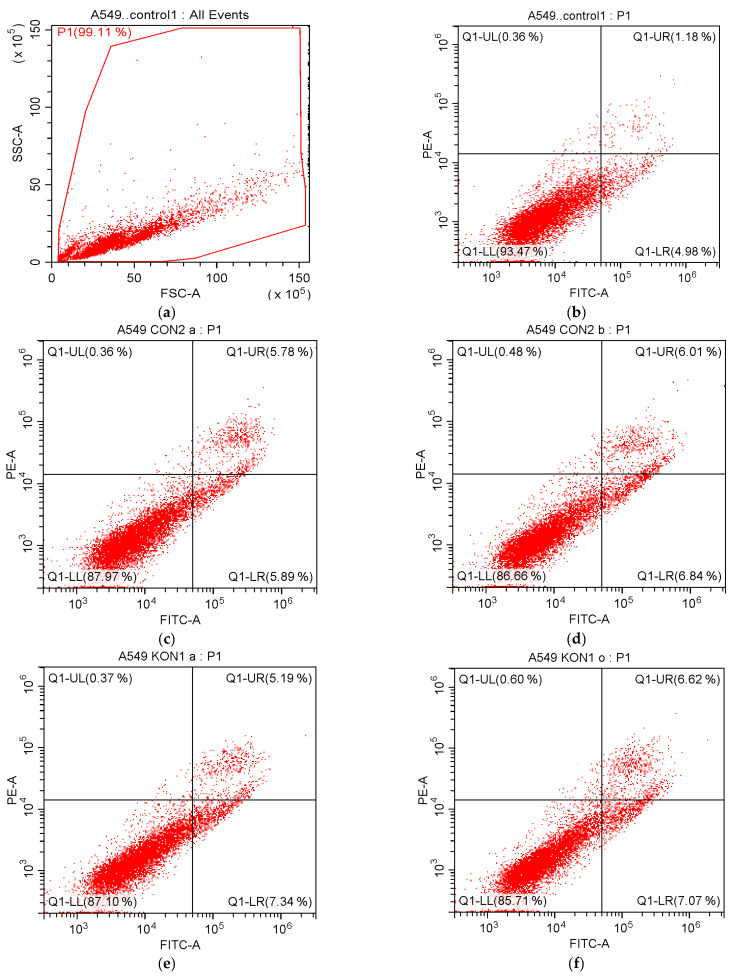
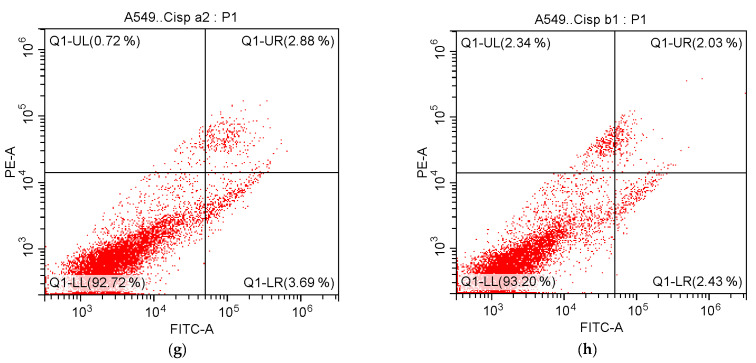
Figure 5.
Flow cytometric analysis of A549 cells treated with IC50/2 and IC50 concentrations of compounds 3b, 4a, and cisplatin. At least 10,000 cells were analyzed per sample, and quadrant analysis was performed. Q1-LR, Q1-UR, Q1-LL, and Q1-UL quadrants represent early apoptosis, late apoptosis, viability, and necrosis, respectively. (a) Control; (b) Control; (c) Compound 3b at IC50/2 concentration; (d) Compound 3b at IC50 concentration; (e) Compound 4a at IC50/4 concentration; (f) Compound 4a at IC50/2 concentration; (g) Cisplatin at IC50/2 concentration; (h) Cisplatin at IC50 concentration.


