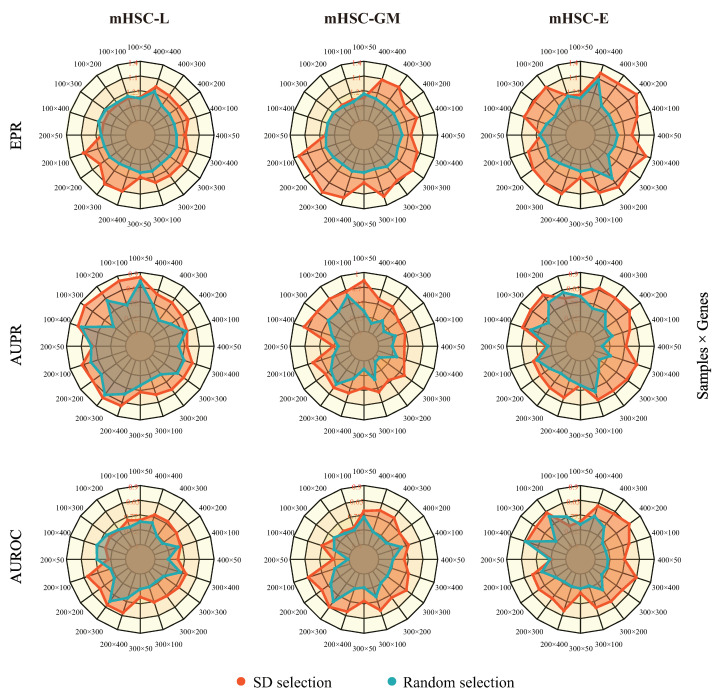
Figure 2.
The robustness of our model on different data scales. Each column corresponds to a cell’s sub-dataset (left: mHSC-L, middle: mHSC-GM, and right: mHSC-E), and each row corresponds to an evaluation index (top: EPR, middle: AUPR, and bottom: AUROC). The red region of the figure is the result of standard deviation selection, and the blue region of the figure is the result of random selection. Pretraining and fine-tuning were not conducted for each test.

