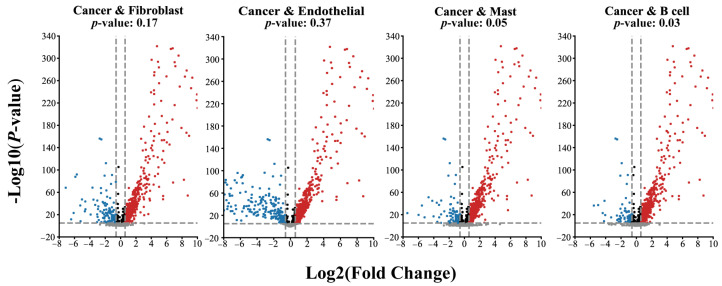
Figure 4.
The divergence of gene expression on different cell types. The red dot represents the genes with a positive correlation, the blue dot represents the genes with a negative correlation, and the black dot represents the gene with no difference in expression level. The grey dot represents the gene below the threshold.

