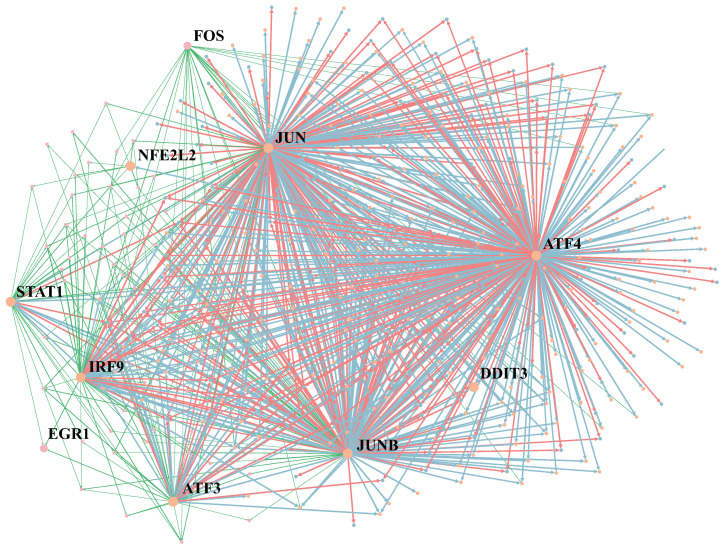
Figure 6.
Visualization of the GRN inference by MetaSEM on Cancer and Fibroblast datasets. The size of nodes indicates the regulatory weight. The blue edges are the main part of GRN, indicating the common regulatory relationship between the two cells. Green and red regulatory relationships only exist in Cancer GRNs or Fibroblast GRNs.

