Figure 6.
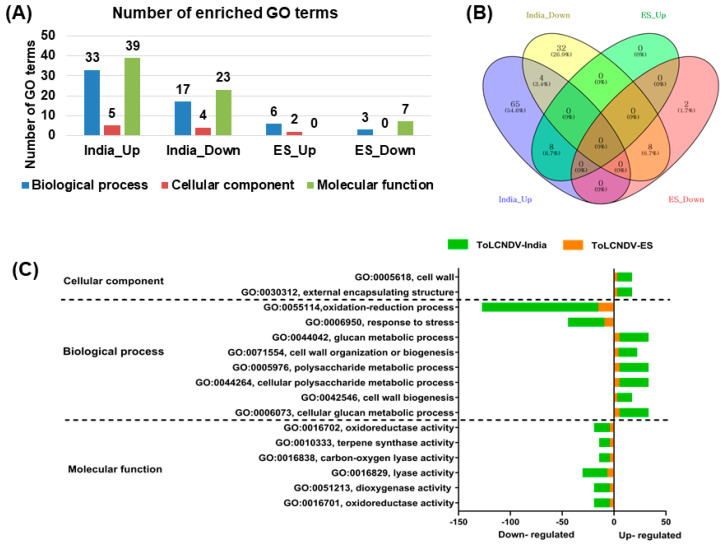
GO enrichment analysis under two ToLCNDV isolates infection. (A) The number of identified enriched GO terms. The graph shows the significant upregulated and downregulated GO terms involved in biological process (blue bars), cellular component (dark-red bars), and molecular function (green bars). (B) The Venn diagram represents the DEGs among 4 groups (India-Up, India-Down, ES-Up, and ES-Down). (C) The GO classification in both ToLCNDV conditions. The number of upregulated and downregulated genes calculated in ToLCNDV-India and -ES, represented by the green and orange colors according to the legend.

