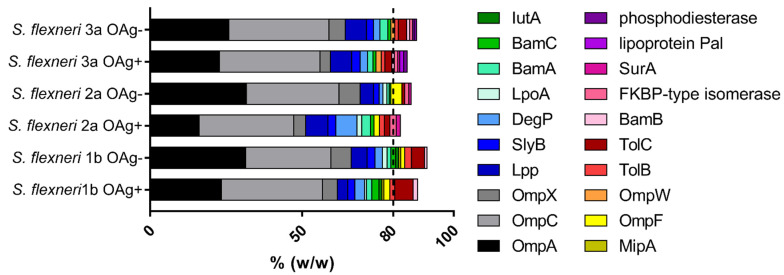
Figure 1.
Proteomic analysis of S. flexneri GMMA (most abundant proteins). Proteomic analysis was performed by LC–MS/MS. A global set of 20 proteins was identified as those showing an abundance superior to 0.5% in the six different samples. The abundance of each protein in the OAg-positive and OAg-negative GMMA was compared. Results derived from two independent trypsin digestions of each GMMA preparation, each of them acquired in a single LC-MS/MS acquisition.

