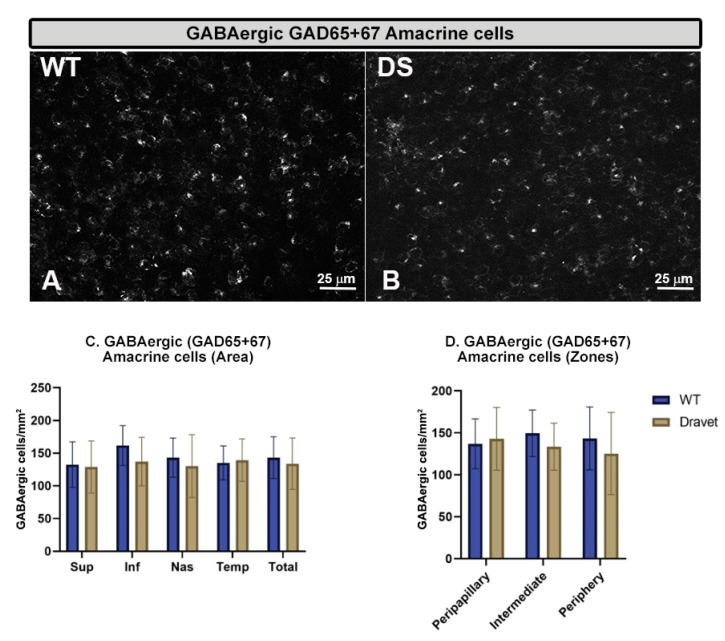
Figure 5.
Retinal ganglion cell (RGC) number. (A,B): retinal whole-mounts labeled with anti-Brn3a at 20× magnification in WT animals (A) and in Dravet syndrome (DS) animals (B). (C,D): number of Brn3a + RGCs per retinal area 0.1502 mm2 by total retina and areas (C) and by zones (D). Two-way ANOVA. Data expressed as mean value (±SD). Number of retinas used in the experiment: WT animals n = 6, DS animals n = 6. Sup: superior; Inf: inferior; Nas: nasal; Temp: temporal.

