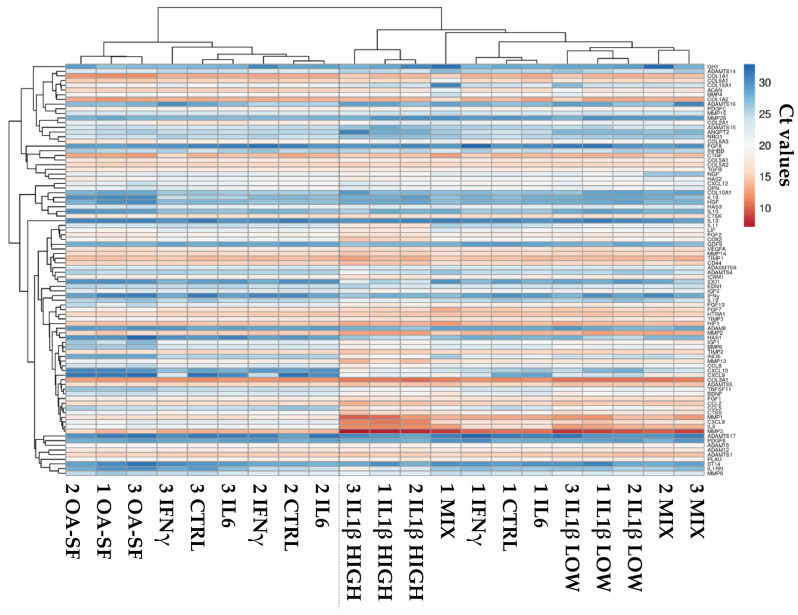
Figure 2.
Heatmap showing differential expression of 88 genes between control (CTRL) and stress treatments (OA-SF for synovial fluid from OA-patients, IL1β HIGH for 1 ng/mL IL1β, IL1β LOW for 100 pg/mL IL1β, IL6 for 209 pg/mL IL6, for 86 pg/mL IFNγ and MIX for the three cytokines including IL1β at low levels) in the three HCH donors. Red shades indicate higher expression and blue shades indicate lower expression. Color key indicates the intensity associated with normalized Ct values.

