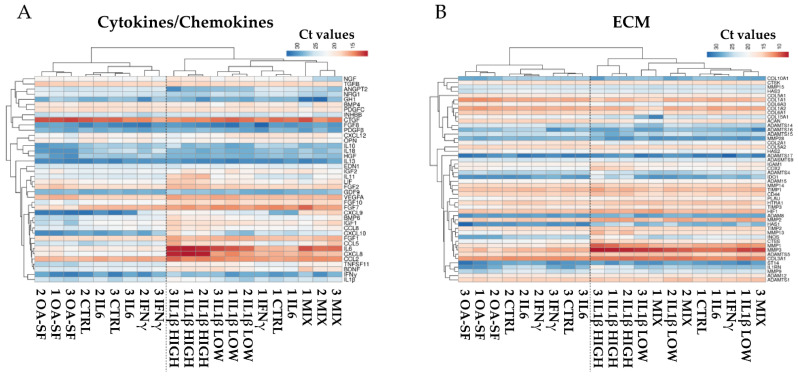
Figure 3.
Heatmap showing differential expression of either cytokine/chemokine (A) or ECM (B) related genes between control (CTRL) and stress treatments (abbreviations as in Figure 2) in the three HCH donors. Red shades indicate higher expression and blue shades indicate lower expression. Color key indicates the intensity associated with normalized Ct values.

