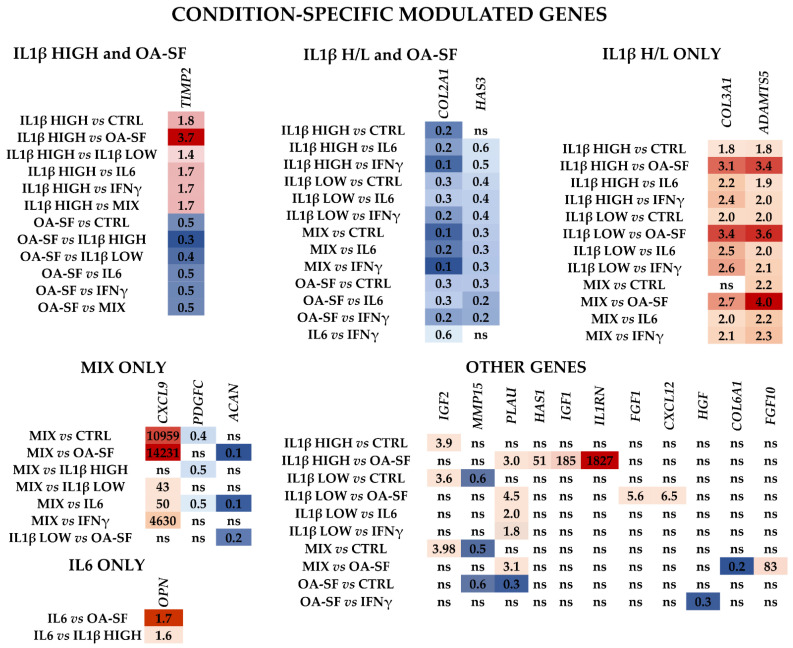
Figure 6.
Differential expression of other single or multiple condition specific genes with respect to control (CTRL) and the other stress treatments (abbreviations as in Figure 2) in the three HCH donors. Red shades indicate higher expression ratios and blue shades indicate lower expression ratios of each group/condition with respect to the other conditions. Color key indicates the intensity associated with expression ratios. Mean values are shown. ns = not statistically significant (p-value > 0.05). p-value for each shown ratio can be found in Supplementary Table S4.

