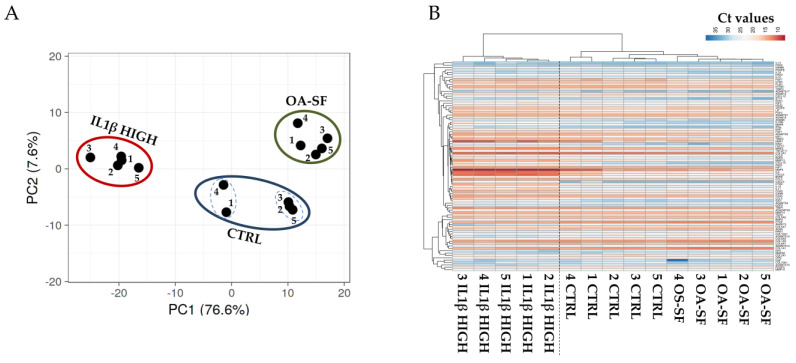
Figure 7.
PCA (A) and heatmap (B) showing differential expression of 88 genes between control (CTRL) and stress treatments (abbreviations in Figure 2) in the previously analyzed three HCH donors (1/2/3) and two new independent ones (4/5). In the heatmap, red shades indicate higher expression and blue shades indicate lower expression. Color key indicates the intensity associated with normalized Ct values.

