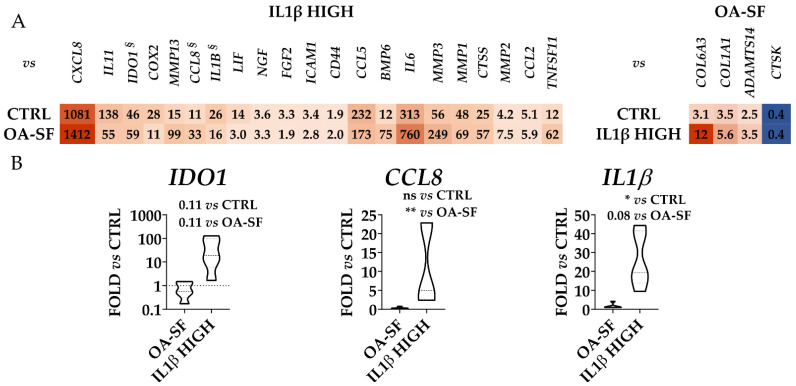
Figure 8.
Differential expression of IL1β HIGH and OA-SF-specific genes (only those significantly modulated vs. each other in Figure 4 and Figure 5) with respect to control (CTRL) and the other treatment for the five HCH donors. (A) Red shades indicate higher expression ratios and blue shades indicate lower expression ratios with respect to the other conditions. Color key indicates the intensity associated with expression ratios. Mean values are shown. p-value for each shown ratio can be found in Supplementary Table S5. (B) Violin plots show the expression of the genes with p-values > 0.05 in one or both ratios (§ in panel A). * for p-value ≤ 0.05, ** for p-value ≤ 0.01.

