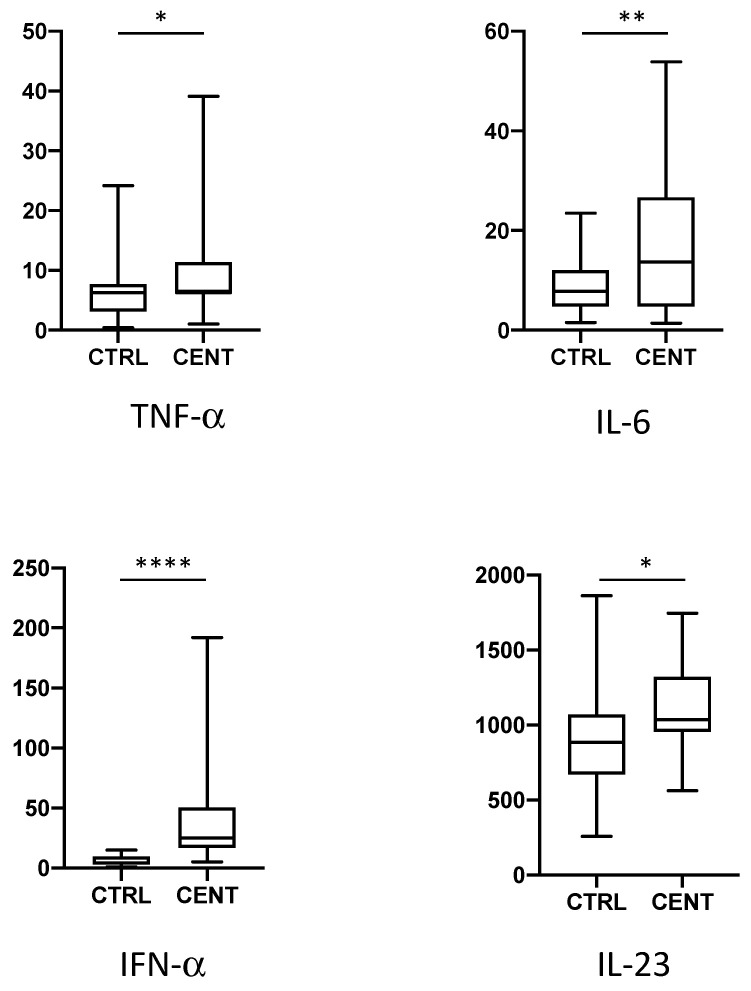
Figure 1.
Plasma levels of pro inflammatory cytokines in controls (CTRL) and centenarians (CENT). Only cytokines whose levels were significantly different between groups are shown. Data are expressed as pg/mL. Boxes represent mean, 25 and 75 percentiles, while whiskers represent min and max values. * = p < 0.05; ** = p < 0.01; **** = p < 0.0001.

