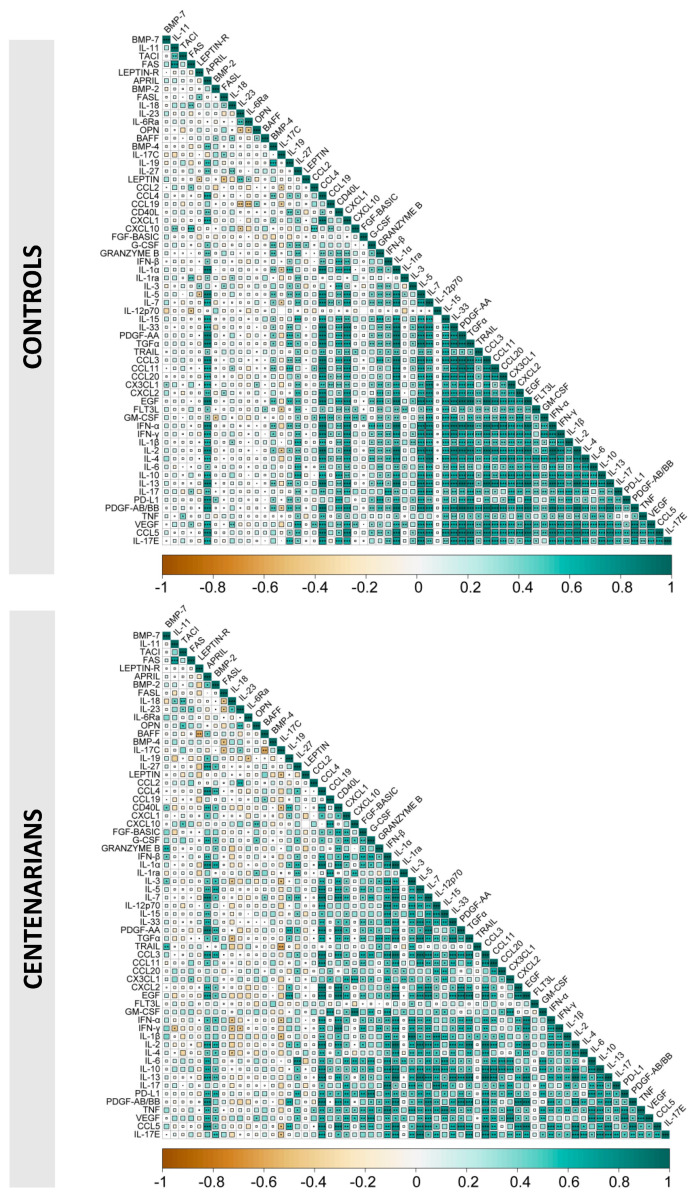
Figure 6.
Correlations among plasma cytokines in young donors and centenarians. Correlograms show the correlations among plasma levels of the measured cytokines in control subjects (upper panel) and centenarians (lower panel). Spearman R values are shown from orange (−1.0) to green (1.0); r values are indicated by color and square size. Blank fields with dots indicate lack of signal. Statistical significance is indicated by * =p < 0.05, ** =p < 0.01, and *** =p < 0.001 inside each square.

