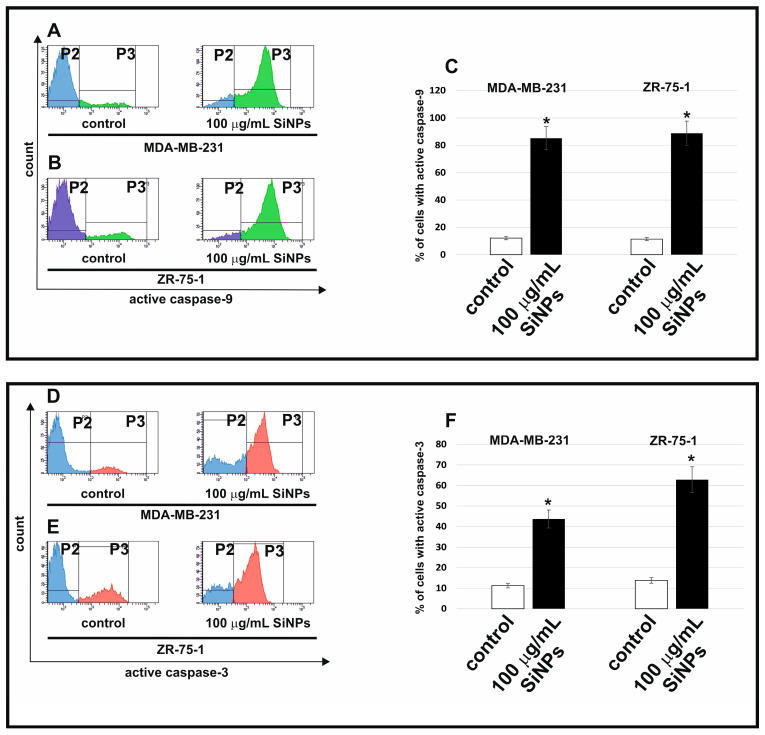
Figure 4.
The flow cytometry analysis of active caspase-9 (A–C) and caspase-3 (D–F) in MDA-MB-231 and ZR-75-1 cell lines. The cells were incubated with 100 μg/mL 5–15 nm SiNPs for 48 h. (A,B) illustrate the histograms of MDA-MB-231 and ZR-75-1 cells-stained FAM FLICA caspase 9. (D,E) illustrate the histograms of MDA-MB-231 and ZR-75-1 cells-stained anti-Caspase-3-PE. (C,F) illustrate the percentage of MDA-MB-231 and ZR-75-1 cells with active caspase-9 and caspase-3. (A,B,D,E) show gate P2 (population of cells without active caspase-9 or active caspase-3) and gate P3 (population of cells with active caspase-9 or active caspase-3). Mean values from three independent experiments ± SD are presented. Significant alterations are expressed relative to controls and marked with asterisks. * p < 0.001.

