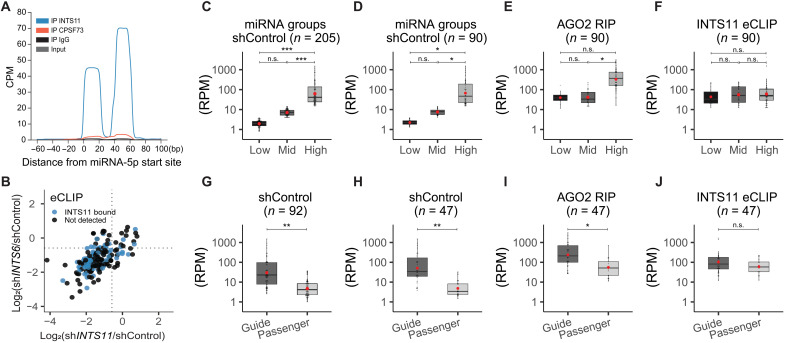
Fig. 5. Integrator-bound miRNAs are independent of miRNA abundance.
(A) Global average of INTS11, CPSF73, IgG, and size-matched input eCLIP profiles around 112 5p-miRNAs aligned at their start site. (B) Scatterplot of the log2 fold change of 205 miRNAs in after INTS6 (y-axis) or INTS11 (x-axis) depletion (see also Fig. 4D) with concomitant labeling of INTS11-bound miRNAs (detected by eCLIP, n = 90). (C to F) Classification according miRNA abundance. (C) Two hundred five detected miRNAs from shControl smRNA-seq were separated by tertiles to define “low-,” “mid-,” and “high-”expression miRNAs. (D) Same as in (C), calculated with the subset of 90 miRNAs also detected from INTS11 eCLIP. (E) Abundance of the 90 miRNAs subset detected from AGO2 RIP, according to previously defined expression classes. (F) Abundance of miRNAs detected in eCLIP. (G to J) Classification according miRNA type (guide or passenger miRNA). (G) Abundance of 92 miRNA couples detected in shControl smRNA-seq and separated by type. (H) Same as (G), calculated with the subset of 47 miRNAs and also detected from INTS11 eCLIP. (I) Abundance separated by type of the 47 miRNA subset detected from AGO2 RIP. (J) INTS11 eCLIP miRNA abundance separated by type. Red circles indicate mean. Statistics were calculated using either one-way ANOVA followed by Tukey’s post hoc test (C to F) or Welch two-sample t test (G to J). *P < 0.05, **P < 0.01, and ***P < 0.001.

