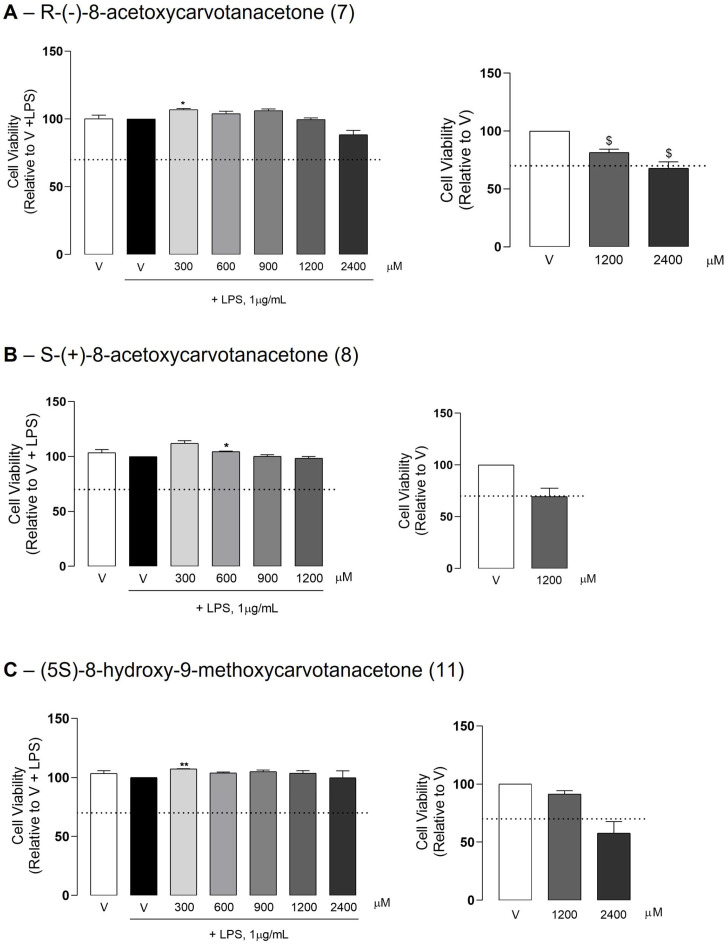
Figure 1.
Effect of the test compounds on cell viability. Raw 264.7 macrophage cultures were treated with the selected concentrations of the test compounds or the vehicle (0.1% DMSO) for 1 h followed by the addition of LPS and further incubation for 18 h, or treated with 1200 or 2400 μM of each test compound or the vehicle alone (0.1% DMSO) also for 18 h. Each column represents the mean ± SEM of three independent experiments. * p < 0.05 and ** p < 0.01 relative to LPS-treated cells. $ p < 0.05 relative to the vehicle alone (V). The dotted line represents the 70% cell viability mark that is accepted according to ISO 10993-5, as the lower limit for the absence of cytotoxicity.

