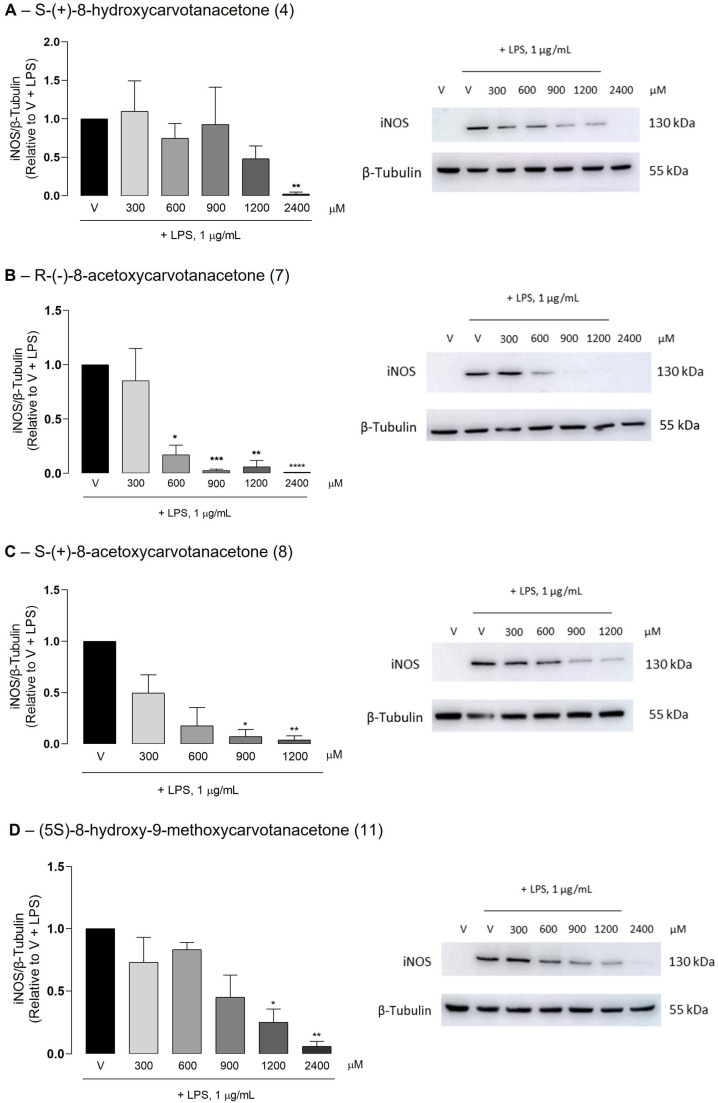
Figure 3.
Inhibition of the LPS-induced iNOS protein levels by the test compounds. Raw 264.7 macrophage cultures were treated with 1 μg/mL LPS for 18 h, following pretreatment with the vehicle (0.1% DMSO) or the indicated concentrations of the test compounds. The control cells (V) were treated with vehicle alone (0.1% DMSO) in the absence of LPS. Representative images of Western blots are shown. Images of the full-length blots are provided in Supplementary Material (Figures S25–S28). Each column represents the mean ± SEM of three independent experiments. * p < 0.05, ** p < 0.01, *** p < 0.001 and **** p < 0.0001 relative to the LPS-treated cells.

