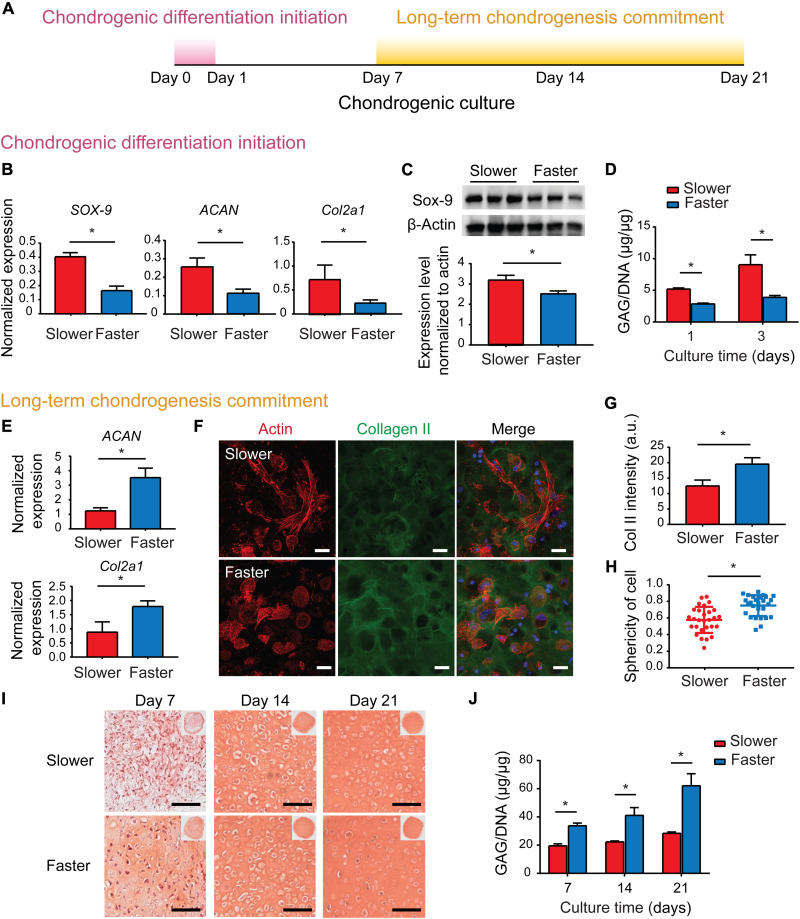
Fig. 3. Matrix viscoelasticity plays different roles in the periods of chondrogenic differentiation initiation and long-term chondrogenesis.
(A) Schematic of protocol to characterize chondrogenic results in different stages. (B) Gene expression of SOX-9, ACAN, and Col2a1 (day 1; two independent experiments were performed, one representative experiment is shown, n = 4; *P < 0.05; data are shown as means ± SD). (C) Western blot of expression levels of Sox-9 and β-actin (day 1). Quantification of immunoblotting for Sox-9 (two independent experiments were performed, one representative experiment is shown, n = 3; *P < 0.05; data are shown as means ± SD). (D) Quantification of GAGs produced by MSCs (days 1 and 3; two independent experiments were performed; one representative experiment is shown; n = 3; *P < 0.05; data are shown as means ± SD). (E) Gene expression of ACAN and Col2a1 (day 7; two independent experiments were performed; one representative experiment is shown; n = 4; *P < 0.05; data are shown as means ± SD). (F) Representative images of type II collagen immunofluorescent staining (day 7). Scale bars, 25 μm. (G) Quantification of type II collagen fluorescence intensity (n = 3, *P < 0.05; data are shown as means ± SD). a.u., arbitrary units. (H) Quantification of sphericity of cells (n = 30 single cells from three biological replications; *P < 0.05). (I) Representative images of Safranin O (SO) staining. Scale bars, 100 μm. (J) Quantification of GAGs produced by MSCs (two independent experiments were performed; one representative experiment is shown; n = 3; *P < 0.05; data are shown as means ± SD).

