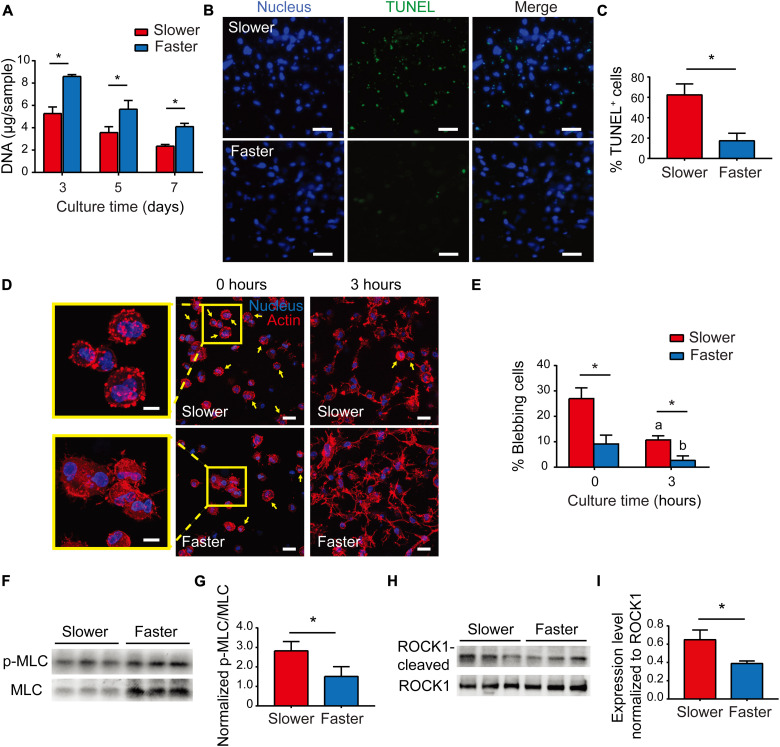
Fig. 4. Matrix viscoelasticity modulates cell survival via regulating ROCK-dependent apoptosis.
(A) Quantification of DNA of MSCs (two independent experiments; one representative experiment is shown; n = 3; *P < 0.05; data are shown as means ± SD). (B) Terminal deoxynucleotidyl transferase–mediated deoxyuridine triphosphate nick end labeling (TUNEL) staining of MSCs (day 3). Scale bars, 50 μm. (C) Quantification of TUNEL-positive cells (n = 5, *P < 0.05; data are shown as means ± SD). (D) Representative images of F-actin staining (0 and 3 hours after collagen gelation). Scale bars, 20 μm. The inserts show magnified images of blebbing cells at 0 hours. Scale bars, 10 μm. Yellow arrows point to blebbing cells. (E) Percentages of blebbing cells (three images from three biological replications per condition; *P < 0.05; data are shown as means ± SD); a indicates a significant difference (*P < 0.05) compared with the slower group at 0 hours; b indicates a significant difference (*P < 0.05) compared with the faster group at 0 hours. (F) Western blot of expression levels of p-MLC and MLC (day 1). (G) Quantification of immunoblotting for MLC activation (two independent experiments with one representative experiment shown; n = 3; *P < 0.05; data are shown as means ± SD). (H) Western blot of expression levels of ROCK cleaved by caspases-3 and ROCK (day 3). (I) Quantification of immunoblotting for cleavage of ROCK (two independent experiments; one representative experiment is shown; n = 3; *P < 0.05; data are shown as means ± SD).

