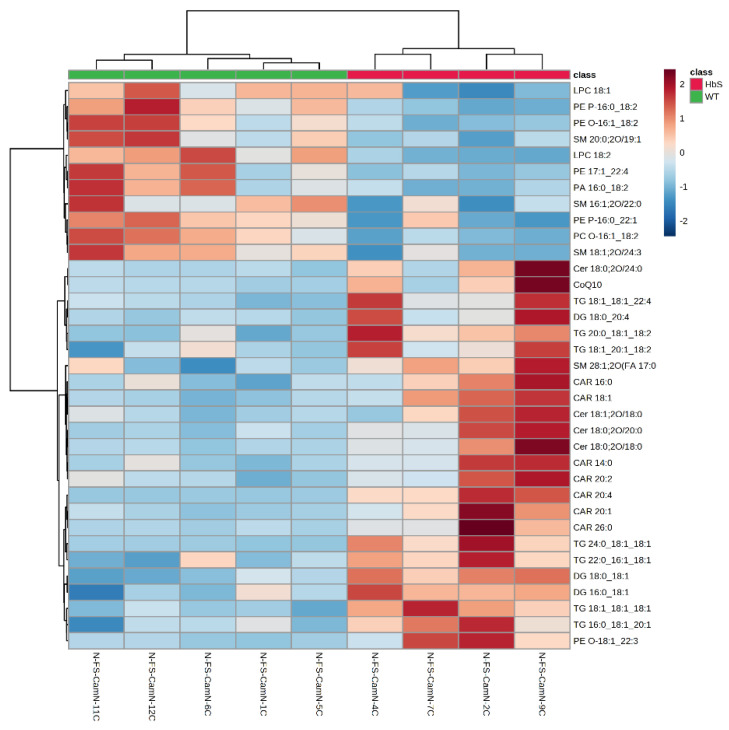
Figure 3.
Heatmap: The figure shows the correlation of the 35 most significant lipid molecular species within each sample. The color shows the level of expression of each individual species in each sample based on their concentrations. The analysis was performed using the Pearson correlation index and the complete clustering method.

