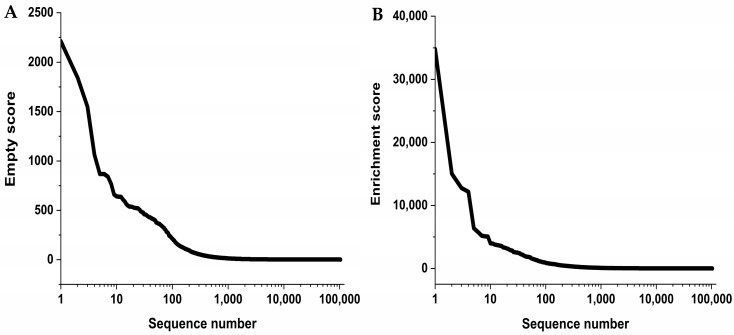
Figure 2.
The selection yielded a small number of sequences with high empty or enrichment scores. The displayed distributions cover all sequences selected in a logarithmic scale on the x-axis. (A) After filtering with TSAT, every sequence was assigned an empty score. This score describes how much higher the frequency of a sequence of the last selection round is compared to its frequency within the control selection (empty selection). With the increasing empty score, the probability of a sequence to be target-specific rises as it is mainly enriched in the target selection. For this selection, we observed a minority of sequences having a very high empty score. Only sequences with an empty score of at least 250 were considered for further testing. (B) As with the empty score, an enrichment score was calculated and assigned to each sequence after filtering. This score describes the increase in frequency a sequence of the last target selection had compared to the library. The distribution of the enrichment score was very similar to the empty score, with a minority of sequences possessing a high score. Only sequences with an enrichment score of at least 250 were considered for further testing.

