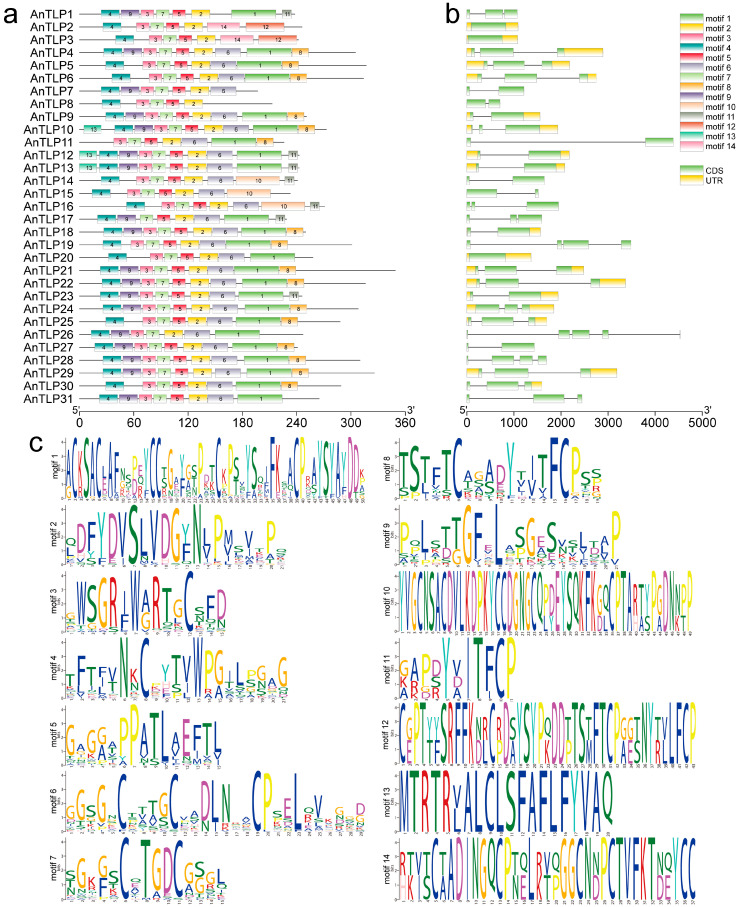
Figure 3.
Conserved motif and gene structure of TLP gene family in A. nanus. (a) The conserved motif analysis of the TLP family of A. nanus. All motifs were identified using the MEME database. The rectangular box represents the motif, and different colors represent different motifs. The lengths of the proteins and motifs can be estimated using the scale at the bottom. (b) The intro–exon structure of the TLP gene family. Black lines represent introns, yellow rectangles represent CDS, and green rectangles represent untranslated regions (UTRs). The size of exons and introns can be estimated using the scale at the bottom. (c) Motif sequence logo graph. The relative size of the letters represents their frequency in the sequence. The height of each letter is proportional to the frequency of occurrence of the corresponding base at that position.

