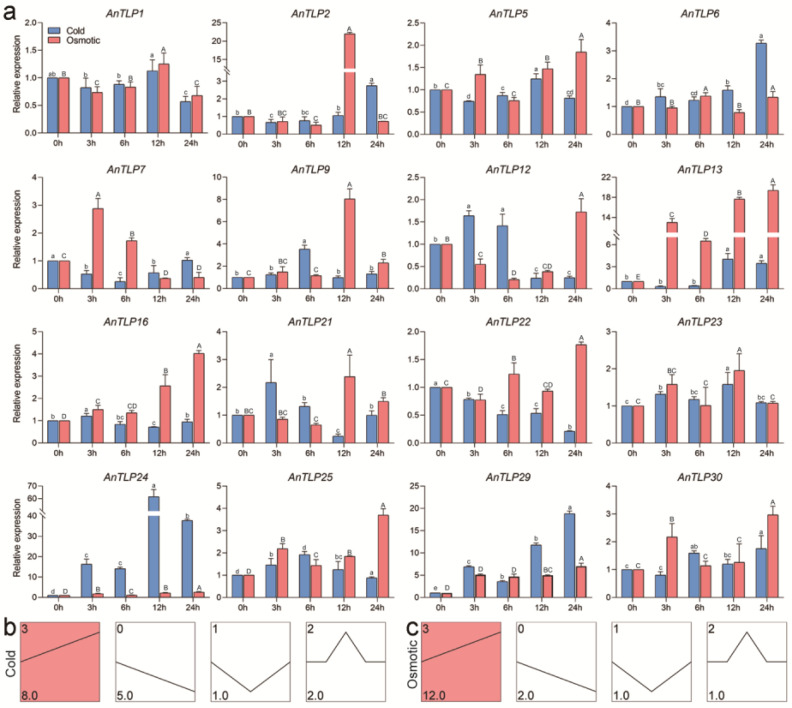
Figure 9.
Expression patterns of AnTLP genes under cold and osmotic stress. (a) Analysis of temporal expression patterns of AnTLP genes under cold and osmotic stress; blue represents cold stress and red represents osmotic stress. The eIF1 gene was used as the internal control gene. The significance between the data of the cold-stress experimental group is marked with lowercase letters, and the significance between the data of the osmotic stress experimental group is marked with uppercase letters. There is no significant difference between the data sharing the same letters; conversely, there are significant differences between the data. (b) Trend analysis of AnTLP genes expression patterns under cold stress. (c) Trend analysis of AnTLP genes expression patterns under osmotic stress. The colored segment is a significantly enriched module. The number in the upper left corner of the module is the number of the module, and the number in the lower right corner represents the number of genes belonging to the module.

