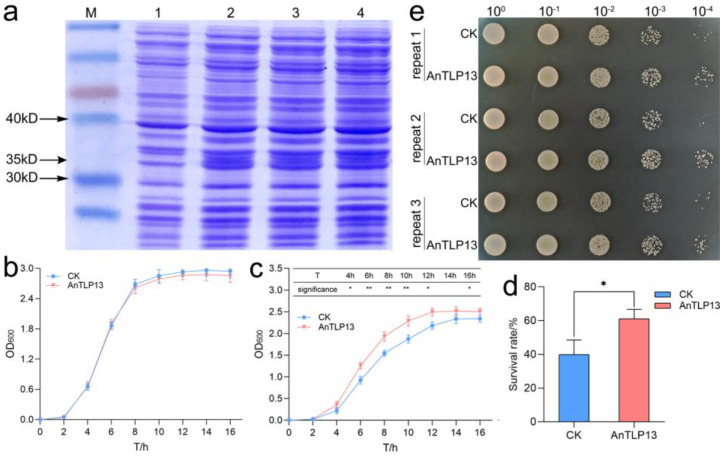
Figure 10.
Overexpression of the AnTLP13 gene enhanced the tolerance to low temperature in E. coli and yeast. (a) Gel electrophoresis of AnTLP13. M in the figure represents the protein marker, and 1 represents the CK group, 2–4 represent the AnTLP13 group. (b) Growth curves of E. coli under normal conditions (37 °C). (c) Growth curves of E. coli under low-temperature stress (28 °C). (d) Survival rate of E. coli under repeated freeze–thaw stress. * and ** indicate p < 0.05 and p < 0.01, respectively. (e) Overexpression of the AnTLP13 gene enhanced the tolerance to repeated freeze–thaw stress in yeast.

