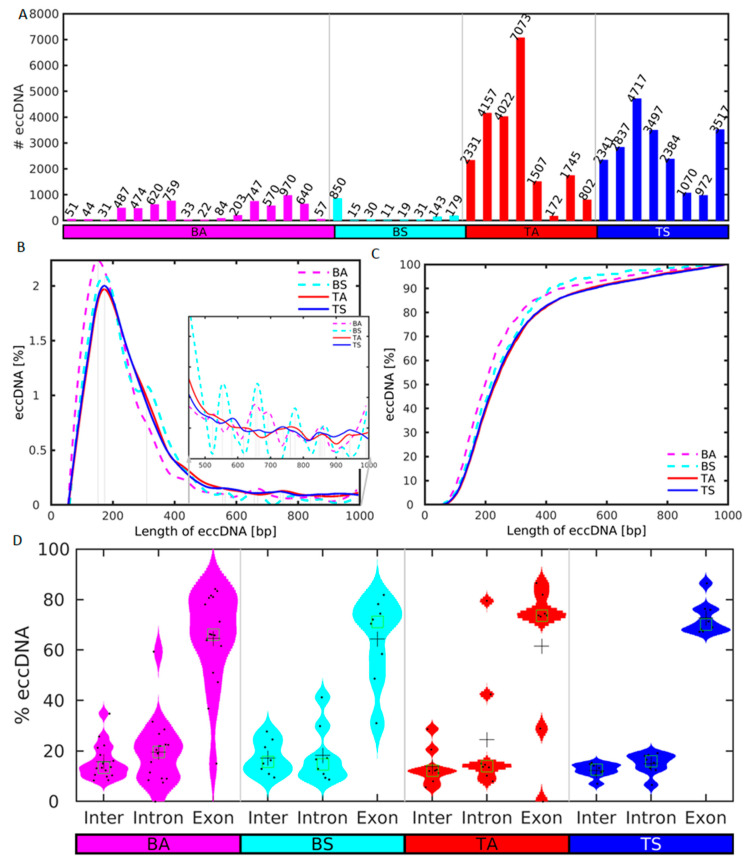
Figure 2.
Distributions of number of unique sequence and length of eccDNA in sedentary (S) and active (A) men in SkM tissue (T) and blood (B). (A) Number of unique eccDNAs in each sample of the S and A groups up to a size of 104 bp after merging and removal of eccDNA with less than 2 split reads. (B) Periodic enrichment of eccDNAs in the two groups in the size range from 0 to 103 bp. The vertical lines mark the local maxima of the more abundant lengths after smoothing. (C) Cumulative distribution of the lengths of the eccDNAs in the range from 0 to 103 bp. The S and A samples are depicted in blue and red, respectively. (D) Violin plots of the distribution of the length of the sequences of the eccDNAs in intergenic, and intron and exon genic regions. Data points are plotted with black dots, mean and median are shown as crosses and squares, respectively.

