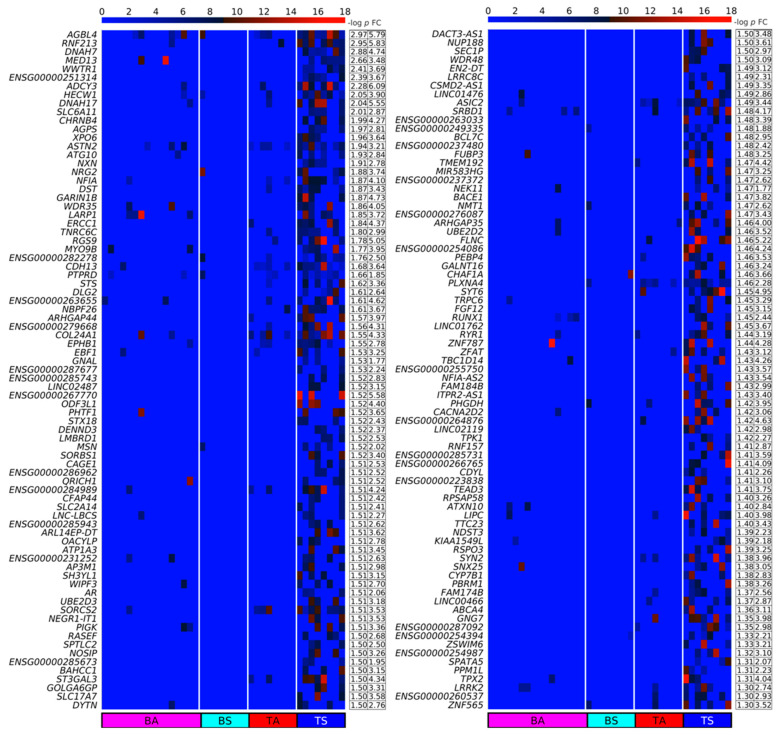
Figure 4.
Heatmaps of the Differentially Up-Produced per Gene DNA Circles (up-DPpGCs) in the SkM of the sedentary lifestyle (TS) compared to the physically active (TA) group in decreasing order of significance. The color bar codifies the split read count of the eccDNA per gene in a log2 scale. Higher count corresponds to a redder color. The –log10 (p-value) and the absolute value of the log2 of the fold change (FC) of the DPpGCs are presented in a table to the right of the heatmap. The PpGCs in the blood samples (leukocytes) from the physically active (BA) and sedentary (BS) group are presented in the heatmap for comparison.

