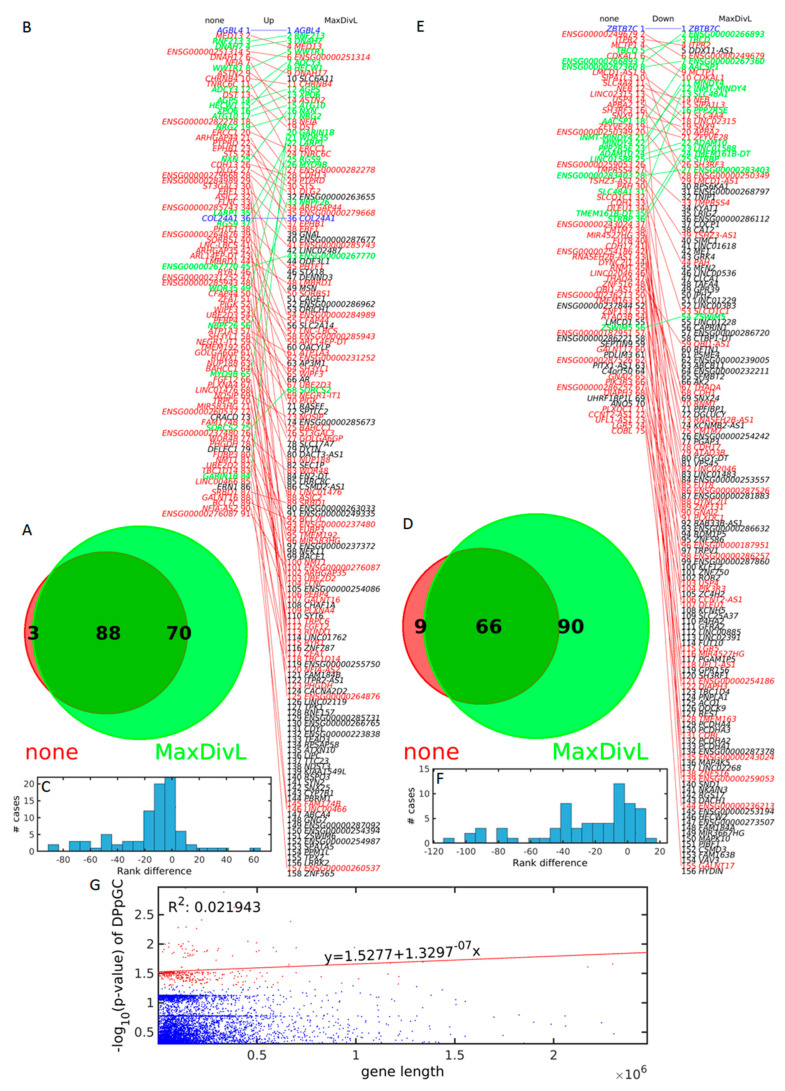
Figure 8.
Analysis of the DPpGCs identified without (none) and with scaling for gene length (MaxDivL) methods. Venn diagram of the intersection of the up-DPpGCs identified without (red) and with (green) scaling for gene length for (A) TS and (D) TA. Comparison of the ranked up-DPpGCs without (left) and with (right) scaling for gene length (B) TS and (E) TA. The blue, red and green lines connect genes with equal, descending, and ascending ranks, respectively. The black gene names correspond to genes non-common between the two scaling methods. Histogram of the rank differences between the two scaling methods (C) TS (F) TA. (G) Relation between the –log10(p-value) of all the up-DPpGCs in TS and TA and the length of the underlying gene. Blue dots indicate PpGCs, red dots mark DPpGCs. The red line is the regression line of the –log10(p-value) of the statistically significant up-DPpGCs in function of the respective gene lengths.

