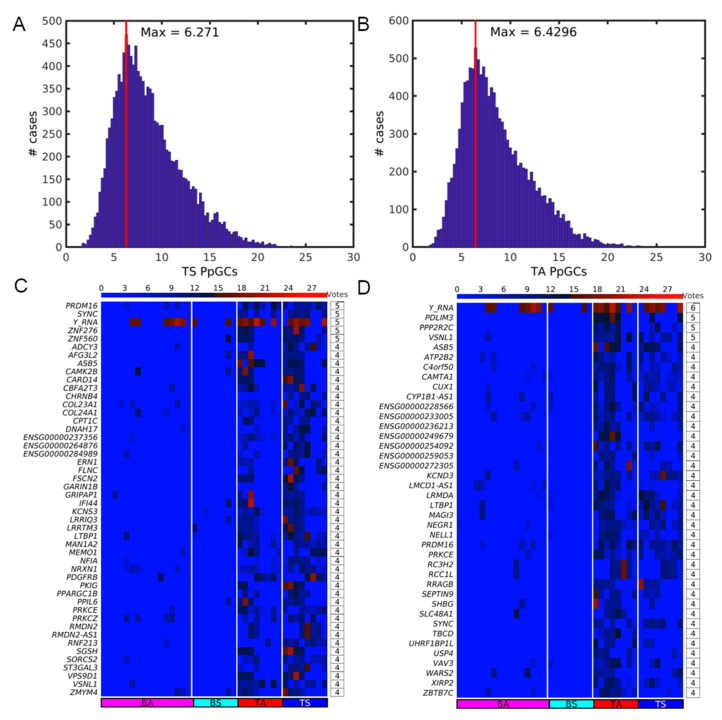
Figure 9.
Democratic method results on the detection of common PpGCs (CPpGCs) in sedentary (TS) and active (TA) SkM. Distribution of the PpGCs for (A) TS and (B) TA. The vertical red line shows the position of the maximum of the distribution. Heatmaps of the CPpGCs in (C) TS and (D) TA. The color bars codify the split read counts of the eccDNAs per gene in a log2 scale. Higher count corresponds to a redder color. The number of votes of the PpGCs is presented in tables to the right of the respective heatmaps.

