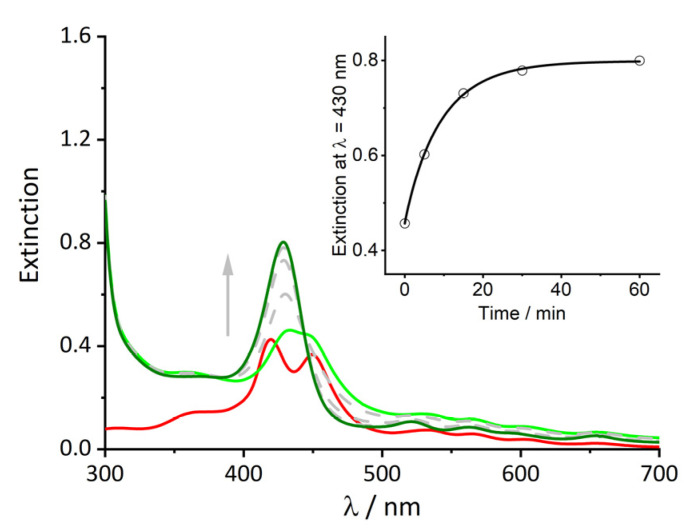
Figure 2.
UV/Vis spectra of t-H2Pagg aggregates (red curve) after addition of HSA at t = 0 s (light green curve) and at t = 60 min (dark green curve). Grey spectra and arrow indicate over time evolution. Inset: change over time of the extinction value at λ = 430 nm relative to the formation of the t-H2Pagg/HSA adduct. Solid line represents the fit obtained with Equation (2) (k = 0.1083 ± 0.0056 s−1, n = 0.94 ± 0.06). Experimental conditions: [t-H2Pagg] = 5 μM, [NaCl] = 100 mM, [HSA] = 100 μM, phosphate buffer 1 mM, pH = 7.4, T = 298 K.

