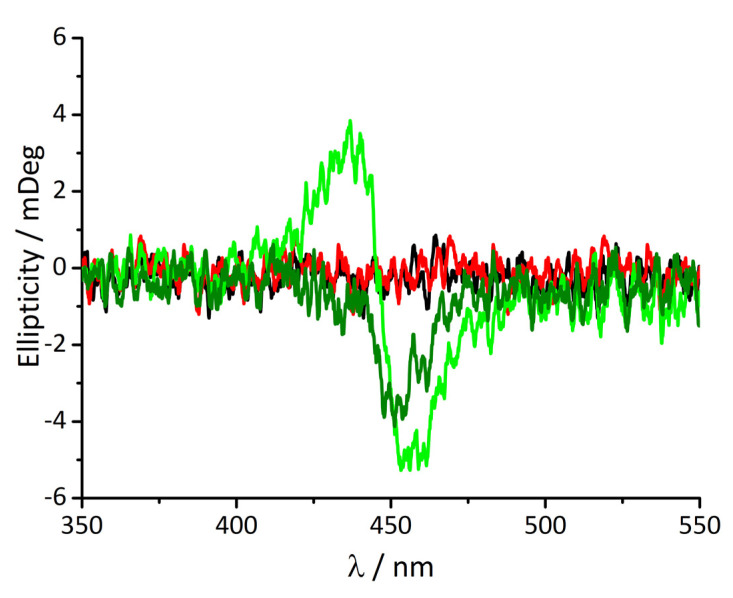
Figure 4.
CD spectra of t-H2Pagg no salt added (black curve), t-H2Pagg aggregates (red curve), after addition of HSA at t = 0 s (light green curve) and at t = 60 min (dark green curve). Experimental conditions: [tH2Pagg] = 5 μM, [NaCl] = 100 mM, [HSA] = 100 μM, phosphate buffer 1 mM, pH = 7.4, T = 298 K.

