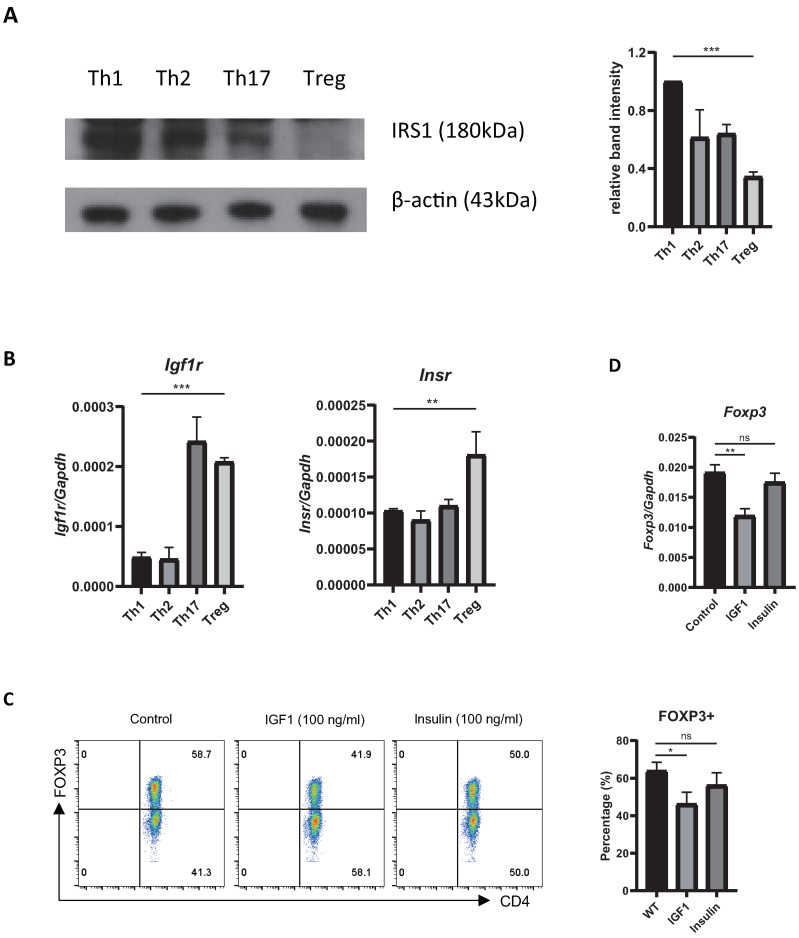
Figure 1.
Expression of IRS and IRS-mediated signaling in Treg cells. (A) IRS1 was measured in Th1, 2, 17, and Treg cells via immunoblotting. Data were normalized to expression of β-actin. Data were pooled from three independent experiments. (B) Naïve CD4 T cells were cultured under Treg-inducing conditions for 3 days, and expression of Igf1r and Insr mRNA was measured via qRT-PCR. (C) Naïve CD4 T cells were cultured under Treg-inducing conditions for 3 days with PBS (control), IGF1, or insulin. FOXP3 protein levels were measured via flow cytometry, and (D) Foxp3 mRNA level was measured via qRT-PCR. Data are representative of three independent experiments. The bar graph next to the flow cytometry data shows data pooled from three independent experiments. The error bars represent the SD, (A–D) p-values were calculated using one-way ANOVA/Tukey test. * p < 0.05, ** p < 0.01, *** p < 0.001. ns: not significant.

