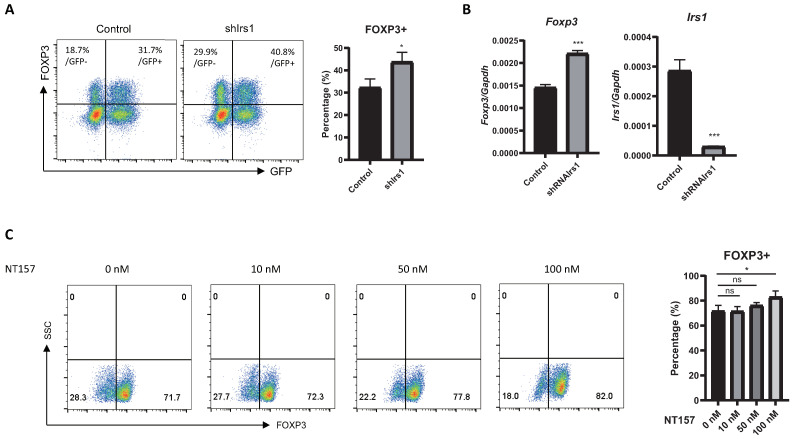
Figure 3.
Knockdown or pharmacological inhibition of IRS1 enhances Treg cell differentiation. (A) Naïve CD4 T cells isolated from C57BL/6J mice were cultured for 1 day under Th0 conditions and then transduced with the shRNA-Irs1 vector. Cells were then cultured for 2 days under suboptimal Treg-inducing conditions. GFP+ cells were used for transduction. FOXP3 expression was measured via flow cytometry. (B) Irs1 and Foxp3 mRNA levels. Expression was measured via qRT-PCR and normalized to that of Gapdh. (C). Naïve CD4 T cells were cultured under Treg-inducing conditions in the presence of NT157 for 3 days, and the percentages of Foxp3-expressing cells were measured via flow cytometry. All data are representative of three independent experiments. The bar graph next to the flow cytometry plot shows data pooled from three independent experiments. The error bars represent the SD, and (A,B) p-values were calculated using a t-test. (C) p-values were calculated using one-way ANOVA/Tukey test. * p < 0.05, *** p < 0.001. ns: not significant.

