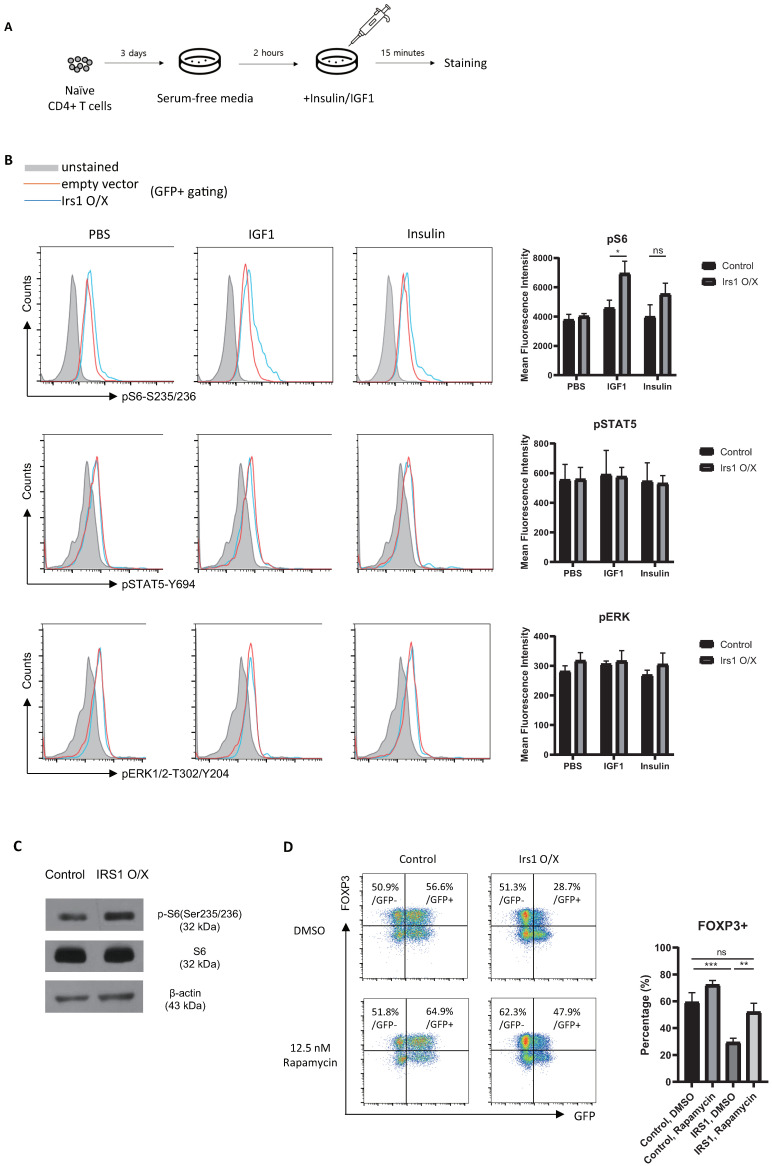
Figure 6.
IRS1 signaling activates the mTORC1, but not the JAK/STAT and ERK pathways. (A) Schematic of the signaling activation experiments. (B,C) Signaling molecules were stained with appropriate antibodies, and cells were analyzed via flow cytometry (B) and via Western blot analysis (C). (D) Naïve CD4 T cells were cultured for 1 day under Th0 conditions and then transduced with the MIEG3-IRS1 vector. Transduced cells were cultured for 2 days under Treg-inducing conditions in the presence of DMSO (control) or rapamycin. The cells were then analyzed via flow cytometry. All data are representative of three independent experiments. The bar graph next to the flow cytometry plot shows data pooled from three independent experiments. The error bars represent the SD, and (B) p-values were calculated using a t-test. (D) p-values were calculated using one-way ANOVA/Tukey test. * p < 0.05, ** p < 0.01, *** p < 0.001. ns: not significant.

