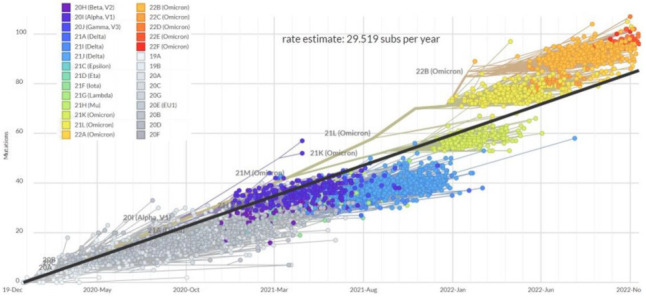
Figure 2.

Clock tree of SARS-CoV-2 evolution, with regression line showing an increase in the estimate rate of substitutions per year across 3045 genomes sampled between December 2019 and November 2022. Accessed online at https://nextstrain.org/ncov/gisaid/global/all-time?l=clock&m=div (accessed on 26 November 2022).
