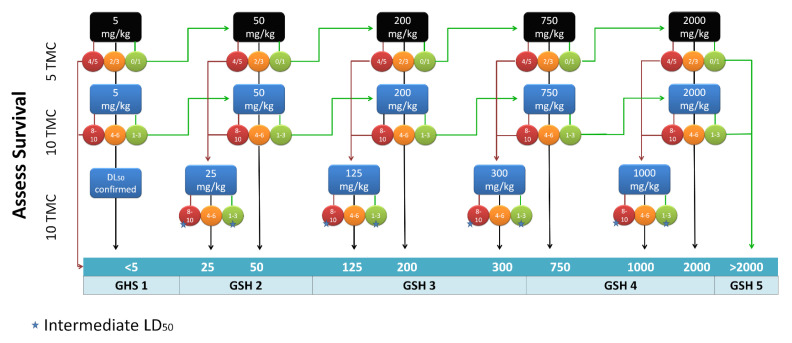
Figure 2.
Flowchart for LD50 determination. Starting from the opportune initial dose, LD50 was determined by changing the dose based on results and increasing the number of TML for final determinations. GHS cat.: Globally Harmonized System category. The numbers on the circles represent the number of deaths in exemplars. The star indicates that if the mortality was not 50%, the experiment was repeated using an intermediate dose.

