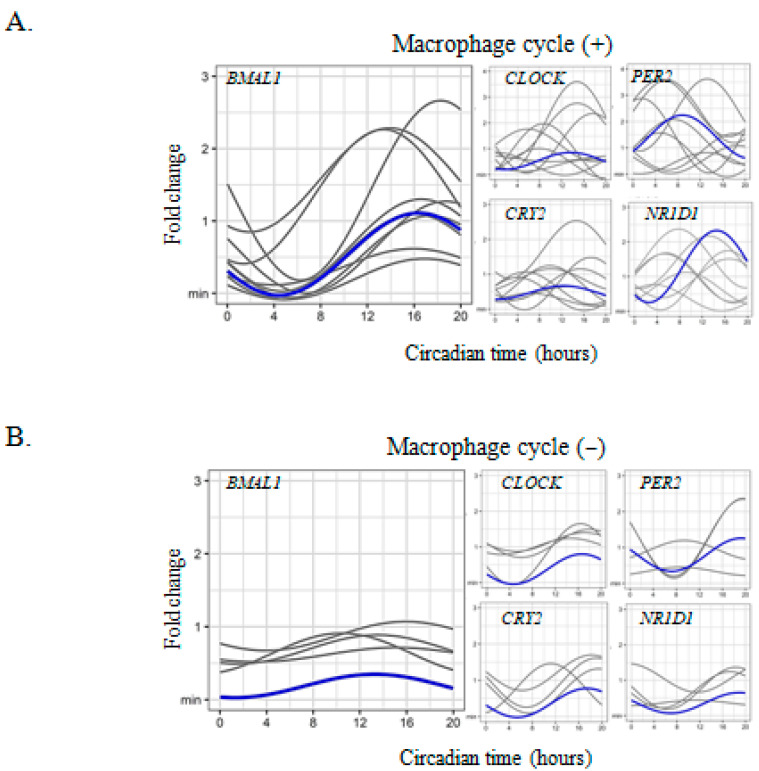
Figure 1.
Circadian clock gene expression in placental macrophages. (A,B) macrophages (n = 13, including (A) n = 9 and (B) n = 4 for macrophages with or without cycle respectively) were isolated from placentas from healthy women and the expression of the clock genes (BMAL1, CLOCK, PER2, CRY2, and NR1D1) was evaluated with qRT-PCR every 4 h for 24 h and expressed in fold change from the maximum value. Each sinusoid (in gray) represents the expression of the clock genes over time for each donor after adjustment of the values by the cosinor model (mean of 3 technical replicates for each donor). The mean of the fold change of biological replicates was represented in blue. The statistical analysis was performed using the cosinor function using R studio (v3.4.0, Boston, MA, USA).

