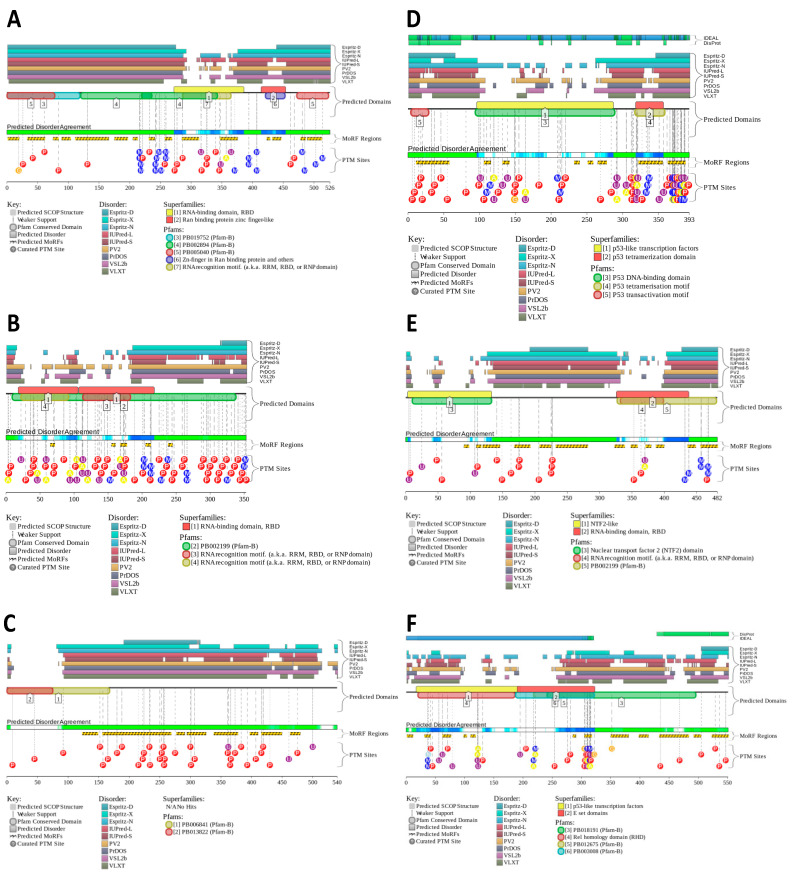
Figure 4.
Functional disorder profiles generated for FUS (A), hnRNPA2 (B), MAVS (C), p53 (D), G3BP2 (E), and p65 (F) by the D2P2 platform, which is a database of predicted disorder for proteins from completely sequenced genomes (https://d2p2.pro/) (last accessed on 9 December 2022). Here, the outputs of IUPred, PONDR® VLXT, PrDOS, PONDR® VSL2, PV2, and ESpritz are used to show disorder predispositions of query proteins by differently colored bars. Consensus between these nine disorder predictors is shown by the blue-green-white bar, whereas location of various PTMs is shown by differently colored circles. D2P2 also shows positions of conserved functional SCOP domains as predicted by the SUPERFAMILY predictor. Positions of these functional domains are shown below the outputs of the nine disorder predictors. Functional disorder profile also includes information on the location of predicted disorder-based binding sites (MoRF regions) identified by the ANCHOR algorithm and various PTMs assigned using the outputs of PhosphoSitePlus.

