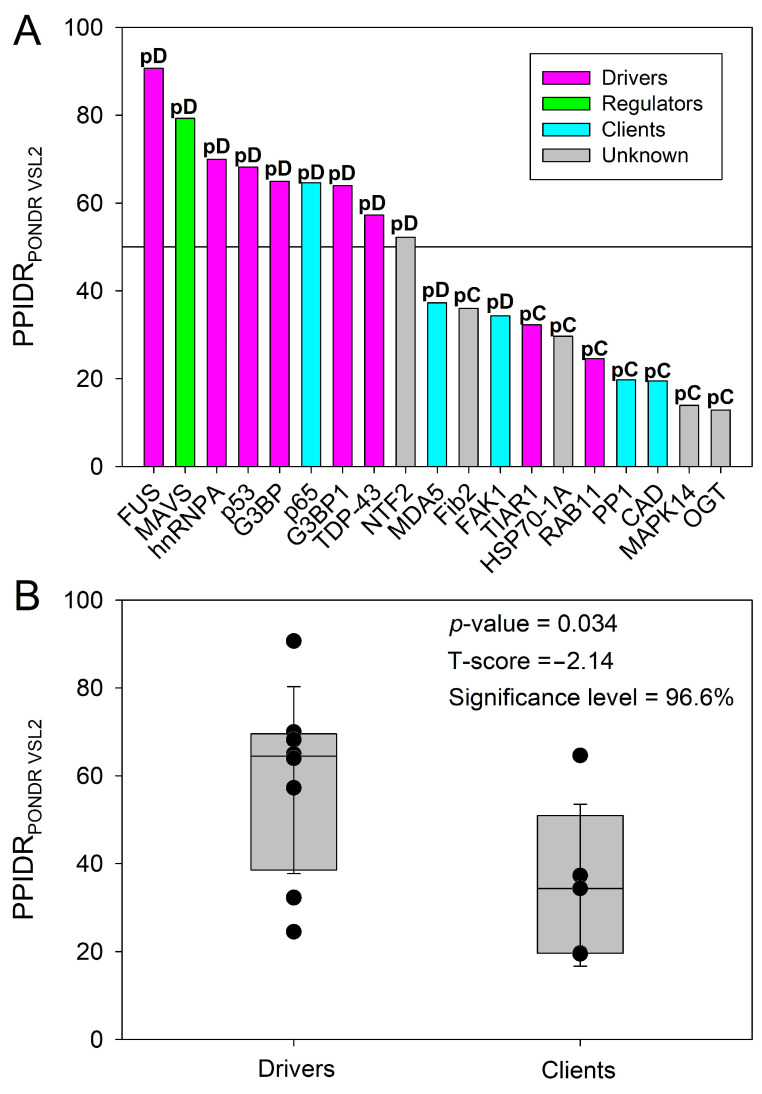
Figure 7.
(A) Correlations between protein intrinsic disorder content, PPIDRPONDR VSL2, evaluated by PONDR® VSL2, and the experimentally validated role in LLPS for each of the 19 proteins in our data set, as retrieved by browsing MLOsMetaDB (https://mlos.leloir.org.ar, accessed on 4 January 2023). The continuous horizontal line corresponds to a 50% content in disorder. Proteins predicted as drivers or as clients by FuzDrop (see Table 1) are marked as pD and pC, respectively. (B) Statistical analysis based on Student’s t-test. Note that both Normality and Equal Variance tests were successfully passed, indicating the suitability of the t-test to assess statistically significant differences. The analysis was conducted using the online Georgiev G.Z., “P-value Calculator” (https://www.gigacalculator.com/calculators/p-value-significance-calculator.php URL, accessed on 5 January 2023).

