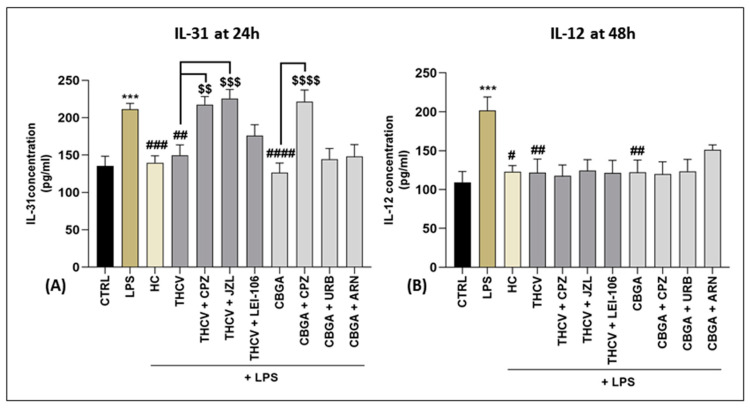
Figure 3.
Release of IL-31 at 24 h and IL-12 at 48 h into HaCaT cells medium. (A) IL-31 and (B) IL-12 expression (pg/mL) in HaCaT cells following 24 h and 48 h treatment with LPS at 5 µg/mL in the presence of HC at 10 µM, including each pCB (THCV at 9.3 µM and CBGA at 13.0 µM) or selected eCB system antagonists and inhibitors (CPZ, 5.0 μM; JZL184, 10.0 μM; LEI-106, 10.0 μM; URB597, 1.0 μM; ARN19874, 33.7 μM). Data are presented as means ± SEM of three independent experiments (n = 3). Statistical analysis was performed using a one-way ANOVA test followed by a Bonferroni post hoc test. (*** p < 0.001 vs. CTRL; # p < 0.05, ## p < 0.01, ### p < 0.001, #### p < 0.0001 vs. LPS; $$ p < 0.01, $$$ p < 0.001, $$$$ p < 0.0001 vs. the respective pCBs: THCV and CBGA).

