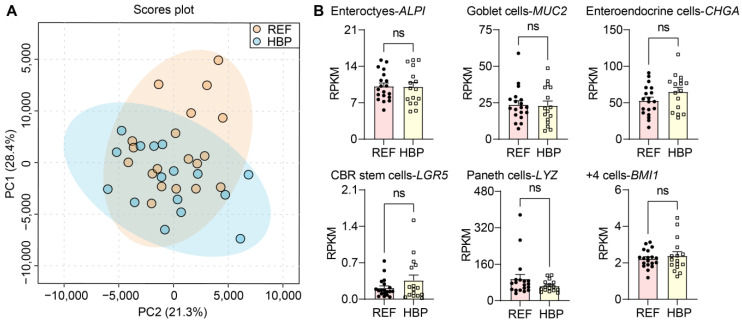
Figure 1.
Quality control of transcriptomic methods and colon sampling. Transcriptome profiling. (A) Principal component analysis (PCA) plot based on complete expression profiles. Blue region is for 95% confidence interval of REF group, yellow region is for 95% confidence interval of HBP group, and blue and yellow dots are representative of the samples of REF and HBP group labelling with systolic blood pressure. (B) Expression of markers of cell type in colon. Reads per kilobase per million (RPKM) values are means ± standard error of the mean (SEM). ns p > 0.05, unpaired t test or Mann–Whitney U test.

