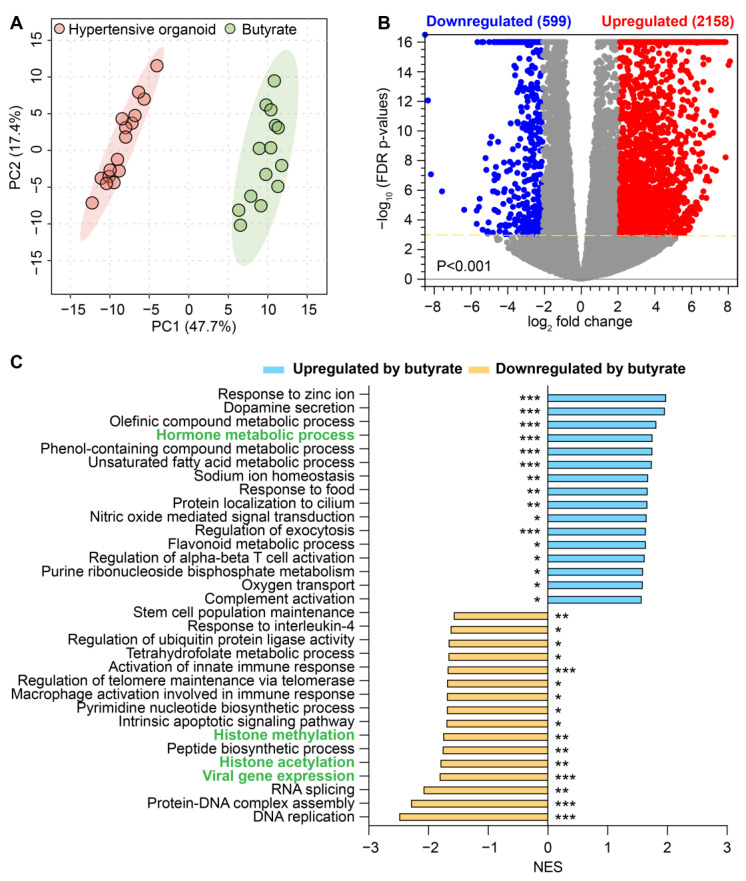
Figure 6.
Comparison of the transcriptomes of colonic organoids without and with butyrate in HBP subjects. (A) Principal component analysis (PCA) plot based on complete expression profiles. Light red region is for 95% confidence interval of human organoids without butyrate (n = 14) and light green region is for 95% confidence interval of human organoids with butyrate (n = 16) in HBP subjects. (B) Volcano plot showing differentially expressed genes (DEGs) in human organoids without and with butyrate in HBP subjects. FDR-corrected p < 0.001, absolute fold change ≥ 4. Blue circles, downregulated DEGs; red circles, upregulated DEGs in human organoids with butyrate; gray circles, genes with no difference in expression. (C) Pathways significantly enriched in human organoids with butyrate compared to without butyrate treatment. Negative NES (blue bar) shows downregulated pathways and positive NES (yellow bar) shows upregulated pathways in human organoids with butyrate. Green-highlighted pathways were dysregulated in HBP colonic tissue, whose pathways could be restored by the butyrate treatment. FDR-corrected * p < 0.05, ** p < 0.01, *** p < 0.001.

