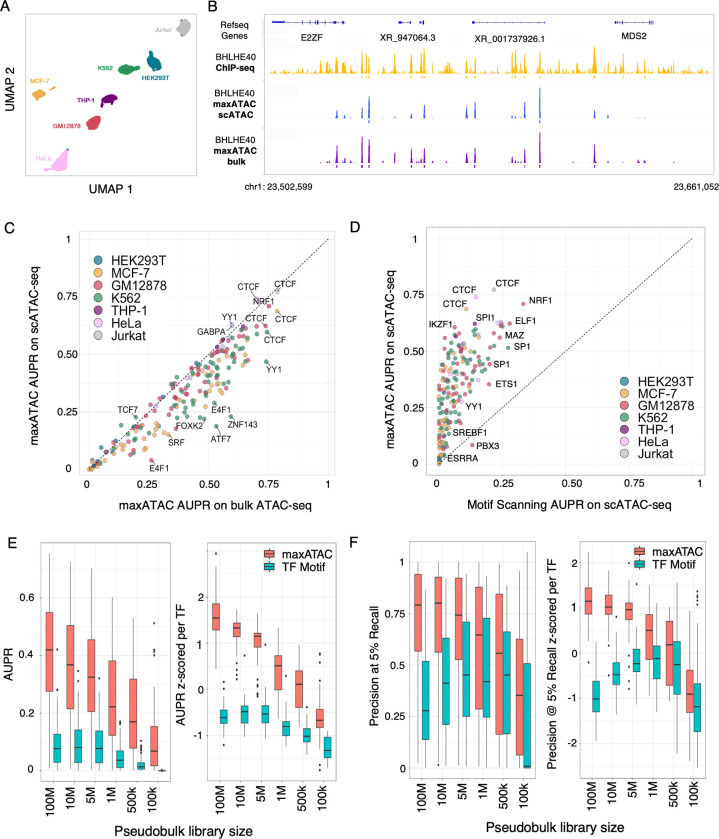
Fig 4. maxATAC offers state-of-the-art TFBS prediction from scATAC-seq.
(A) UMAP of 10x scATAC-seq data from 7 cell types in a cell line-mixing experiment [37] that enabled test performance evaluation for 193 maxATAC models. (B) IGV tracks comparing BHLE40 TFBS predicted by maxATAC in GM12878 from scATAC-seq (blue) or bulk ATAC-seq (purple), relative to BHLE40 ChIP-seq (–log10(p-value) signal tracks in yellow) located at chr1:23,502,599–23,661,052 (158kb region). (C) Test AUPR for maxATAC in scATAC-seq relative to maxATAC performance on bulk ATAC-seq. (D) Test AUPR of maxATAC on scATAC-seq versus AUPR of TF motif scanning on scATAC-seq. Test (E) AUPR and (F) precision at 5% recall performances for maxATAC (red) and TF motif scanning (teal) as a function of down-sampled pseudobulk library sizes from scATAC-seq of GM12878 (n = 55 TFs with maxATAC models and TF motifs available). Given the range of performances per TF model, performances are also z-score normalized per TF, to better visualize model- and library-size-dependent trends.

