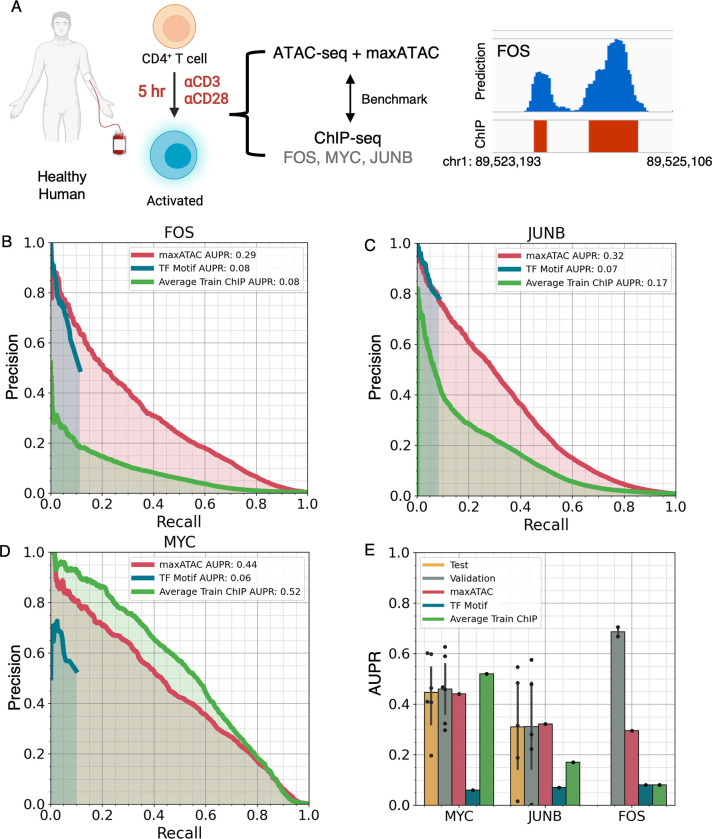
Fig 6. maxATAC models perform well in primary human cells.
(A) Study design for maxATAC benchmarking in primary human CD4+ T cells. Precision-recall curves for TFBS predictions from maxATAC (red line), motif-scanning (blue) and averaged training ChIP-seq signal (green) for (B) FOS, (C) JUNB and (D) MYC, relative to experimentally measured TFBS (ChIP-seq). (E) Comparison of test performance in primary cells (red) to the estimates of test (green) and validation (yellow) performance (available with each trained maxATAC model) as well as TFBS prediction by TF motif scanning (blue) or average training ChIP-seq (green). Each point corresponds to a unique train-test cell type split. Error bars indicate standard deviation. Test performance minimally requires 3 cell types and therefore was available for MYC (n = 6 cell types) and JUNB (n = 5 cell types) but not FOS (n = 2 cell types). Human and cells image was created with BioRender.com.

