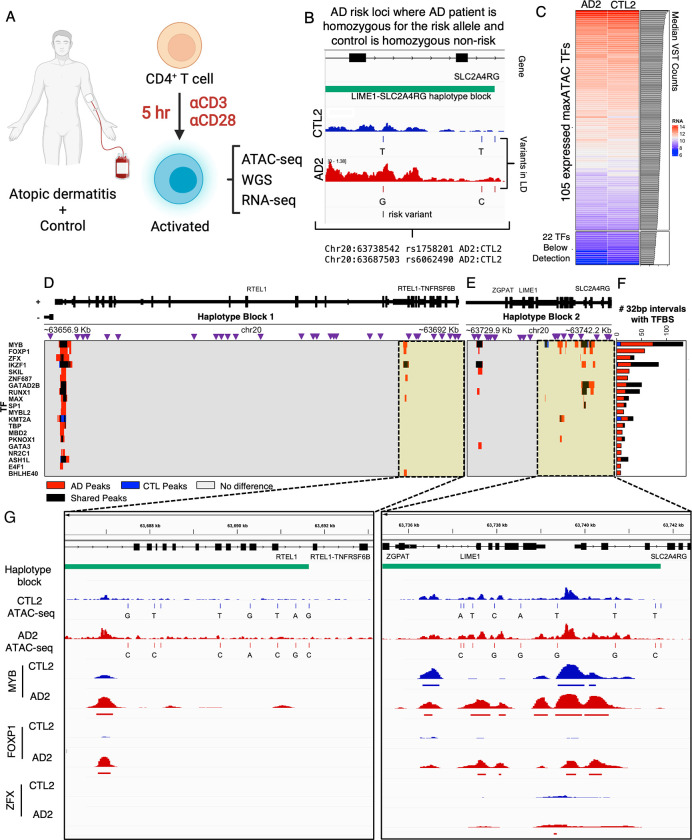
Fig 7. maxATAC TFBS prediction at atopic dermatitis risk loci in patient-derived CD4+ T cells.
(A) In a previous study [54], peripheral CD4+ T cells were isolated from atopic dermatitis (AD) patients and age-matched controls (CTL) and TCR-stimulated prior to ATAC-seq, RNA-seq and whole genome sequencing (WGS) data generation. (B) We identified a pair of donors in which the AD patient (AD2) was homozygous for the risk allele and the age-matched control (CTL2) was homozygous for the non-risk allele at two independent loci: rs1758201 and rs6062490. (C) 105 of the 127 maxATAC TFs were nominally expressed for the donor pair, and these TFs were selected for TFBS prediction with maxATAC. We identified differential TFBS in the haplotype blocks containing (D) rs6062490 and (E) rs1758201. Purple triangles represent SNPs in linkage disequilibrium (R2>.8) with the AD risk alleles. In the heatmap below, red or blue intervals (32bp) indicate respective gain or loss of TFBS in the AD patient relative to control and black denotes intervals of shared TFBS. TFBS were determined using the cutoff that maximizes the predicted F1-score per TF model. (F) The 20 TFs with the greatest number of differential binding regions between AD2 and CTL2 are shown. (G) IGV screenshots showing regions (highlighted in yellow) of predicted differential TFBS in CTL2 (blue tracks) compared to AD2 (red tracks). The haplotype block is indicated in green. The top 4 signal tracks represent donor-specific ATAC-seq signal and genetic variants. The bottom 6 signal tracks represent predicted TFBS. Human and cells image was created with BioRender.com.

