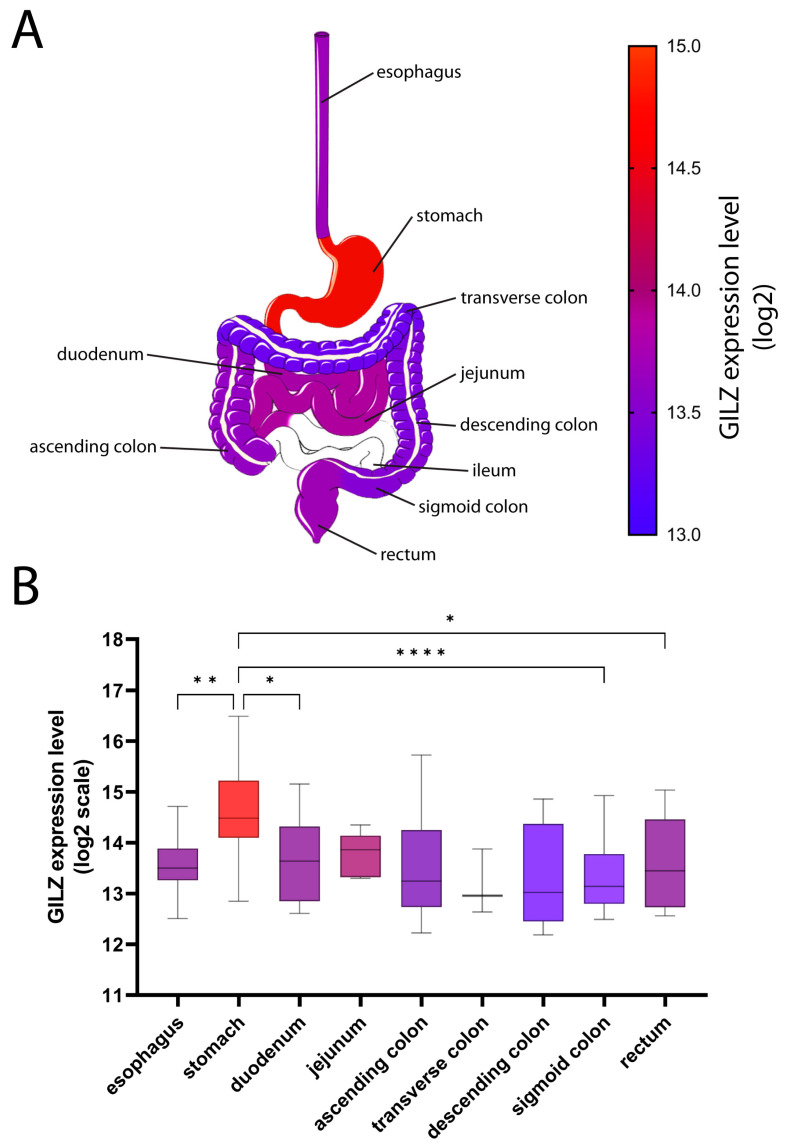
Figure 1.
GILZ expression in different parts of the gut. (A) GILZ expression levels along the GI tract range from 13 (blue) to 15 (red) on the log2 scale. (B) Mean expression levels of GILZ are shown as a box-and-whiskers plot (Tukey). The scale for the box colors is the same as that for (A). p-values < 0.05 were considered statistically significant; p < 0.05 = *; p < 0.01 = **; p < 0.0001 = ****.

