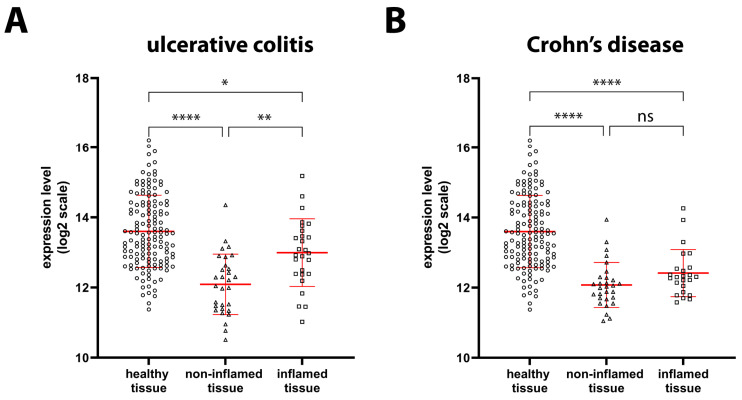
Figure 2.
GILZ in healthy, UC, and CD tissues. (A) GILZ gene expression levels based on microarray data were compared between healthy tissue (circles, n = 142), as well as non-inflamed (triangles, n = 30) and inflamed (squares, n = 27) tissue from UC patients. (B) GILZ gene expression levels based on microarray data were compared between healthy tissue (circles, n = 142), as well as non-inflamed (triangles, n = 29) and inflamed (squares, n = 24) tissue from CD patients. Data are shown by using a scatter plot, with each dot representing a single patient; values are shown in log2 scale and expressed as mean ± SD. p-values <0.05 were considered statistically significant; p < 0.05 = *; p < 0.01 = **; p < 0.0001 = ****. ns = non-significant.

