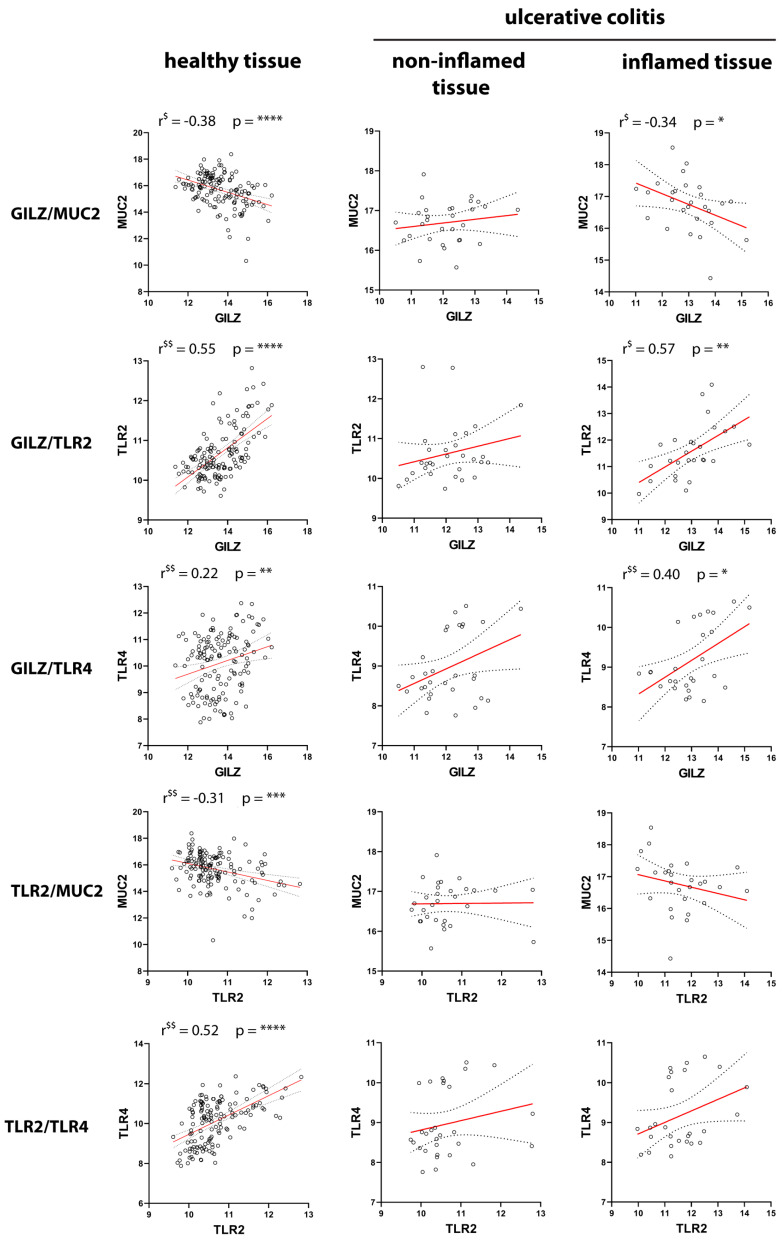
Figure 5.
Pairwise correlations between GILZ, MUC2, TLR2, and TLR4 in healthy and UC tissues. Correlations between the expressions of the four genes in healthy control tissue (left panels), noninflamed tissue (middle panels), and inflamed tissue (right panels) from UC patients are shown. $: significant according to Pearson’s correlation analysis; $$: significant according to Spearman’s correlation analysis. p-values < 0.05 were considered statistically significant; p < 0.05 = *; p < 0.01 = **; p < 0.001 = ***; p < 0.0001 = ****. Non-significant correlations (p > 0.05) were not reported.


