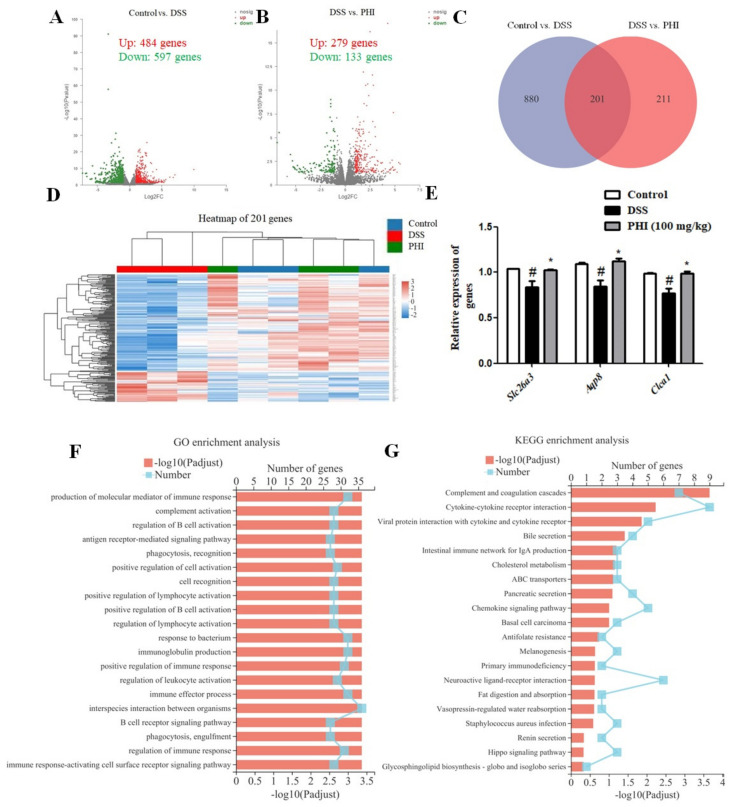
Figure 6.
PHI (100 mg/kg) treatment altered transcriptional profiles of colitis mice. (A) Genes volcano map of control vs. DSS. (B) Genes volcano map of DSS vs. PHI. (C) Venn diagram of genes. (D) The clustering heat maps of 201 genes. (E) Genes were validated by using qRT-PCR. (F) Results of GO enrichment analysis. (G) Results of KEGG enrichment analysis. # P < 0.05 vs. control group. * P < 0.05vs. DSS-induced group (n = 3 mice per group).

