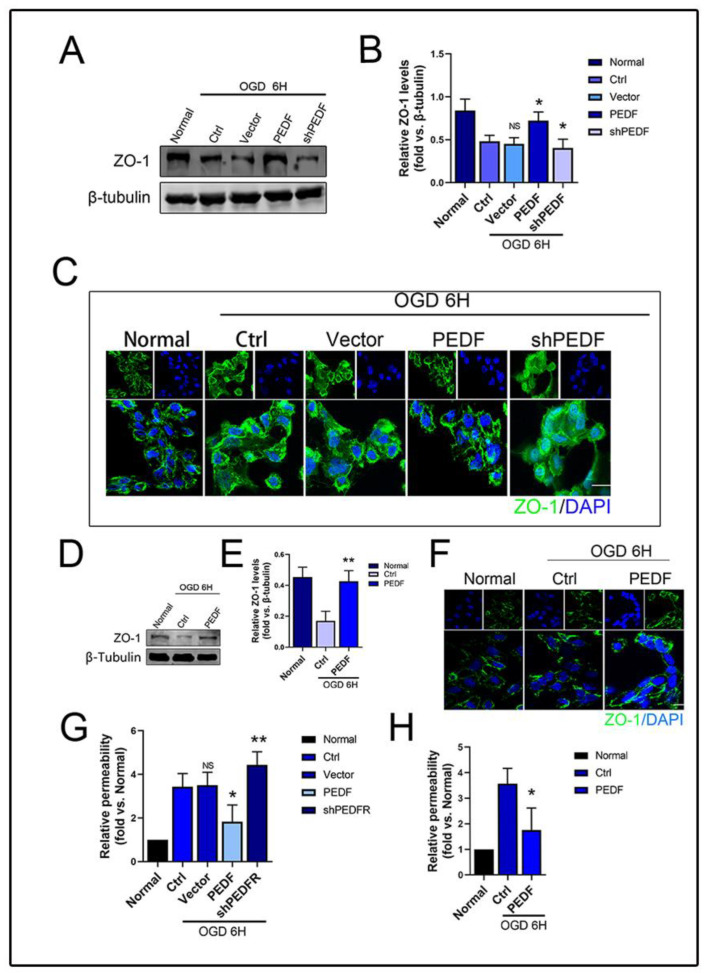
Figure 2.
The effect of PEDF on the permeability of HUVECs during OGD. (A,B) Western blotting to detect the effect of PEDF on the expression of ZO-1 in vivo. (C) Immunofluorescence to observe the effect of PEDF on the distribution of ZO-1 in vivo. Scale Bar = 200 μm. (D,E) Western blotting to detect the effect of PEDF on the expression of ZO-1 in vitro. (F) Immunofluorescence to observe the effect of PEDF on the distribution of ZO-1 in vitro. Scale Bar = 200 μm (G,H) Quantification of the effect of PEDF on endothelial cell permeability. Data are expressed as mean ± SD; n = 4; NS, no significant difference; * p < 0.05; ** p < 0.01.

